
Page 18 - Rotating Machinery Pratical Solutions to Unbalance and Misalignment
P. 18
Introduction to Vibrations
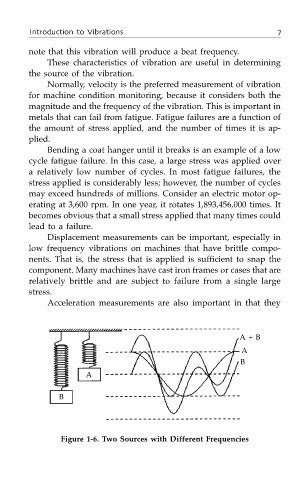
note that this vibration will produce a beat frequency.
These characteristics of vibration are useful in determining
the source of the vibration.
Normally, velocity is the preferred measurement of vibration
for machine condition monitoring, because it considers both the
magnitude and the frequency of the vibration. This is important in
metals that can fail from fatigue. Fatigue failures are a function of
the amount of stress applied, and the number of times it is ap-
plied.
Bending a coat hanger until it breaks is an example of a low
cycle fatigue failure. In this case, a large stress was applied over
a relatively low number of cycles. In most fatigue failures, the
stress applied is considerably less; however, the number of cycles
may exceed hundreds of millions. Consider an electric motor op-
erating at 3,600 rpm. In one year, it rotates 1,893,456,000 times. It
becomes obvious that a small stress applied that many times could
lead to a failure.
Displacement measurements can be important, especially in
low frequency vibrations on machines that have brittle compo-
nents. That is, the stress that is applied is sufficient to snap the
component. Many machines have cast iron frames or cases that are
relatively brittle and are subject to failure from a single large
stress.
Acceleration measurements are also important in that they
A + B
A
B
A
B
Figure 1-6. Two Sources with Different Frequencies