
Page 71 - Rotating Machinery Pratical Solutions to Unbalance and Misalignment
P. 71
Field Balancing
3. Most often, the trial weight is placed neither on the heavy
spot, nor directly opposite it. In this case the amplitude may
go up or down, but there would be a definite change in the
location of the reference mark. The angle and direction the
trial weight must be moved, and the correct amount of the
weight must be determined from a vector diagram.
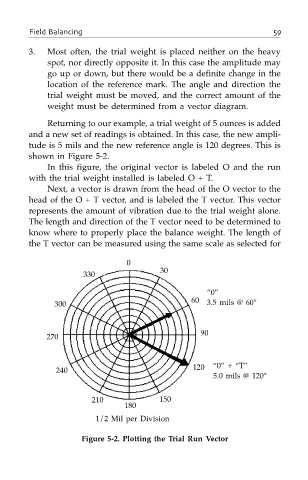
Returning to our example, a trial weight of 5 ounces is added
and a new set of readings is obtained. In this case, the new ampli-
tude is 5 mils and the new reference angle is 120 degrees. This is
shown in Figure 5-2.
In this figure, the original vector is labeled O and the run
with the trial weight installed is labeled O + T.
Next, a vector is drawn from the head of the O vector to the
head of the O + T vector, and is labeled the T vector. This vector
represents the amount of vibration due to the trial weight alone.
The length and direction of the T vector need to be determined to
know where to properly place the balance weight. The length of
the T vector can be measured using the same scale as selected for
0
30
330
“0”
60
300 3.5 mils @ 60°
90
270
120 “0” + “T”
240
5.0 mils @ 120°
210 150
180
1/2 Mil per Division
Figure 5-2. Plotting the Trial Run Vector