
Page 202 - Safety Risk Management for Medical Devices
P. 202
On Testing 181
Using the Risk Assessment and Control Table (RACT) as a source for risk deter-
mination, follow these steps:
Step 1. Examine the RACT to identify the Risk Controls which link to the
safety requirement in question.
Step 2. Identify the Hazards that are linked to the Risk Controls which were
identified in Step 1.
Step 3. For the aggregate of all the Hazards that were identified in Step 2, com-
pute the residual risk in each Harm severity class. Use Boolean algebra’s
De Morgan’s Theorem and Law of Identity.
Step 4. Within the aggregate identify the Harm severity class with the peak risk value.
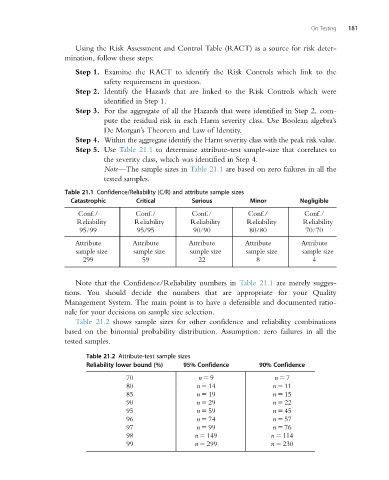
Step 5. Use Table 21.1 to determine attribute-test sample-size that correlates to
the severity class, which was identified in Step 4.
Note—The sample sizes in Table 21.1 are based on zero failures in all the
tested samples.
Table 21.1 Confidence/Reliability (C/R) and attribute sample sizes
Catastrophic Critical Serious Minor Negligible
Conf./ Conf./ Conf./ Conf./ Conf./
Reliability Reliability Reliability Reliability Reliability
95/99 95/95 90/90 80/80 70/70
Attribute Attribute Attribute Attribute Attribute
sample size sample size sample size sample size sample size
299 59 22 8 4
Note that the Confidence/Reliability numbers in Table 21.1 are merely sugges-
tions. You should decide the numbers that are appropriate for your Quality
Management System. The main point is to have a defensible and documented ratio-
nale for your decisions on sample size selection.
Table 21.2 shows sample sizes for other confidence and reliability combinations
based on the binomial probability distribution. Assumption: zero failures in all the
tested samples.
Table 21.2 Attribute-test sample sizes
Reliability lower bound (%) 95% Confidence 90% Confidence
70 n 5 9 n 5 7
80 n 5 14 n 5 11
85 n 5 19 n 5 15
90 n 5 29 n 5 22
95 n 5 59 n 5 45
96 n 5 74 n 5 57
97 n 5 99 n 5 76
98 n 5 149 n 5 114
99 n 5 299 n 5 230