
Page 211 - Safety Risk Management for Medical Devices
P. 211
190 Safety Risk Management for Medical Devices
Risk tolerance is influenced by many factors including:
2 The values of the society
2 The population at risk (children, adults, etc.)
2 Available alternative therapies
2 The nature of the disease (acute, chronic, degenerative, etc.)
2 Trust in the manufacturer
• Availability of alternative therapies—For some diseases alternative therapies may be
available. For example, pharmaceuticals and gene therapy. If a device provides a
benefit, though small, for a disease for which no alternative therapy exists, it
may still get approved.
Sometimes a medical device shows greater risk than a comparable device on the
market, but it may be approved to add to the portfolio of available treatments for
patients. A higher-risk device may also get approved, if it shows greater efficacy for a
subpopulation of the patients or under specific conditions, e.g., hot tropical
environments.
There are certain circumstances where demonstration of acceptability of benefit to
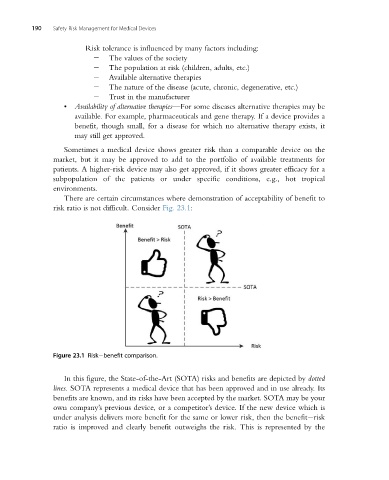
risk ratio is not difficult. Consider Fig. 23.1:
Figure 23.1 Risk benefit comparison.
In this figure, the State-of-the-Art (SOTA) risks and benefits are depicted by dotted
lines. SOTA represents a medical device that has been approved and in use already. Its
benefits are known, and its risks have been accepted by the market. SOTA may be your
own company’s previous device, or a competitor’s device. If the new device which is
under analysis delivers more benefit for the same or lower risk, then the benefit risk
ratio is improved and clearly benefit outweighs the risk. This is represented by the