
Page 127 - Satellite Communications, Fourth Edition
P. 127
Radio Wave Propagation 107
the percentage time is denoted by p and the rain rate by R . The spe-
p
cific attenuation is
b
aR dB/km (4.2)
p
where a and b depend on frequency and polarization. Values for a and
b are available in tabular form in a number of publications. The values
in Table 4.2 have been abstracted from Table 4.3 of Ippolito (1986).
The subscripts h and v refer to horizontal and vertical polarizations
respectively.
Once the specific attenuation is found, the total attenuation is deter-
mined as
L dB (4.3)
where L is the effective path length of the signal through the rain.
Because the rain density is unlikely to be uniform over the actual path
length, an effective path length must be used rather than the actual
(geometric) length. Figure 4.3 shows the geometry of the situation. The
geometric, or slant, path length is shown as L . This depends on the
S
antenna angle of elevation
and the rain height h , which is the height
R
at which freezing occurs. Figure 4.4 shows curves for h for different
R
climatic zones. In this figure, three methods are labeled: Method 1—
maritime climates; Method 2—tropical climates; Method 3—continental
climates. For the last, curves are shown for p values of 0.001, 0.01, 0.1,
and 1 percent.
For small angles of elevation (El 10°), the determination of L is
S
complicated by earth curvature (see CCIR Report 564-2, 1982). However,
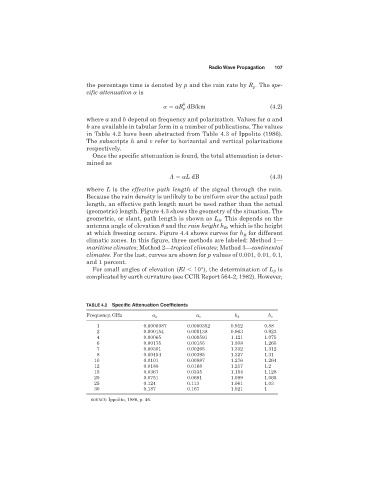
TABLE 4.2 Specific Attenuation Coefficients
Frequency, GHz a h a v b h b v
1 0.0000387 0.0000352 0.912 0.88
2 0.000154 0.000138 0.963 0.923
4 0.00065 0.000591 1.121 1.075
6 0.00175 0.00155 1.308 1.265
7 0.00301 0.00265 1.332 1.312
8 0.00454 0.00395 1.327 1.31
10 0.0101 0.00887 1.276 1.264
12 0.0188 0.0168 1.217 1.2
15 0.0367 0.0335 1.154 1.128
20 0.0751 0.0691 1.099 1.065
25 0.124 0.113 1.061 1.03
30 0.187 0.167 1.021 1
SOURCE: Ippolito, 1986, p. 46.