
Page 87 - Sedimentology and Stratigraphy
P. 87
74 Field Sedimentology, Facies and Environments
representations of data, especially field data, are a possible with drill-core (22.3.2) and is perfectly ade-
quicker and more effective way of recording informa- quate for the most simple ‘layer-cake’ strata (beds that
tion than words. Interpretation of the information in do not vary in thickness or characteristics laterally).
terms of processes and environment (facies analysis – Where an exposure of beds reveals that there is sig-
5.6.1) is normally carried out back in the laboratory. nificant lateral variation, for example, river channel
Computer-aided graphic log presentation has and overbank deposits in a fluvial environment, a
become widespread in recent years, including both single, vertical log does not adequately represent the
dedicated log drawing packages and standard draw- nature of the deposits. A two-dimensional representa-
ing packages (www.sedlog.com). These can provide tion is required in the form of a section drawn of a
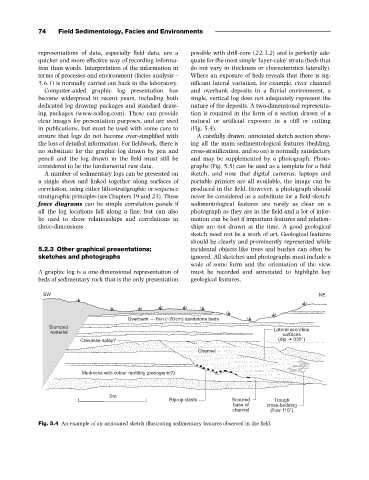
clear images for presentation purposes, and are used natural or artificial exposure in a cliff or cutting
in publications, but must be used with some care to (Fig. 5.4).
ensure that logs do not become over-simplified with A carefully drawn, annotated sketch section show-
the loss of detailed information. For fieldwork, there is ing all the main sedimentological features (bedding,
no substitute for the graphic log drawn by pen and cross-stratification, and so on) is normally satisfactory
pencil and the log drawn in the field must still be and may be supplemented by a photograph. Photo-
considered to be the fundamental raw data. graphs (Fig. 5.5) can be used as a template for a field
A number of sedimentary logs can be presented on sketch, and now that digital cameras, laptops and
a single sheet and linked together along surfaces of portable printers are all available, the image can be
correlation, using either lithostratigraphic or sequence produced in the field. However, a photograph should
stratigraphic principles (see Chapters 19 and 23). These never be considered as a substitute for a field sketch:
fence diagrams can be simple correlation panels if sedimentological features are rarely as clear on a
all the log locations fall along a line, but can also photograph as they are in the field and a lot of infor-
be used to show relationships and correlations in mation can be lost if important features and relation-
three-dimensions. ships are not drawn at the time. A good geological
sketch need not be a work of art. Geological features
should be clearly and prominently represented while
5.2.3 Other graphical presentations: incidental objects like trees and bushes can often be
sketches and photographs ignored. All sketches and photographs must include a
scale of some form and the orientation of the view
A graphic log is a one-dimensional representation of must be recorded and annotated to highlight key
beds of sedimentary rock that is the only presentation geological features.
:
" D
9 .E 6 / & &
" &
%
%
% & ' &
- && & %
B . 6 8C/
-9 %
&
9 %
% . B/
8
* > % &
& 9
" & ' &&>"
9 % .'% 6C/
Fig. 5.4 An example of an annotated sketch illustrating sedimentary features observed in the field.