
Page 90 - Sedimentology and Stratigraphy
P. 90
Palaeocurrents 77
indicators that reflect the river flow, but in overbank plotted. The calculated mean can also be added. The
deposits the flow may have been perpendicular to the base used is a circle divided up with radii at 108 or 208
river channel (9.3). Lastly, not all palaeoflow indica- intervals and containing a series of concentric circles.
tors have the same ‘rank’: due to the irregularities of The data are firstly grouped into blocks of 108 or 208
flow in a channel, a ripple on a bar may be oriented in (0018–0208, 021–0408, etc.) and the number that
almost any direction, but the downstream face of a fall within each range is marked by gradations out
large sandy or gravelly bar will produce cross-bedding from the centre of the circular histogram. In this
that is close to the direction of flow of the river. It is example (Fig. 5.8) three readings are between 2618
therefore good practice to separate palaeoflow indica- and 2708, five between 2518 and 2608, and so on.
tors into their different ranks when carrying out anal- The scale from the centre to the perimeter of the circle
yses of the data. should be marked, and the total number ‘N’ in the
data set indicated.
5.3.3 Presentation and analysis
of directional data 5.3.4 Calculating the mean
of palaeocurrent data
Directional data are commonly collected and used in
geology. Palaeocurrents are most frequently encoun- Calculating the mean of a set of directional data is not
tered in sedimentology, but similar data are collected as straightforward as, for example, determining the
in structural analyses. Once a set of data has been average of a set of bed thickness measurements.
collected it is useful to be able to determine para- Palaeocurrents are measured as a bearing on a circle
meters such as the mean direction and the spread and determining the average of a set of bearings by
about the mean (or standard deviation). The proce- adding them together and dividing by the number of
dure used for calculating the mean of a set of direc- readings does not give a meaningful result: to illus-
tional data is described below. Palaeocurrent data are trate why, two bearings of 0108 and 3508 obviously
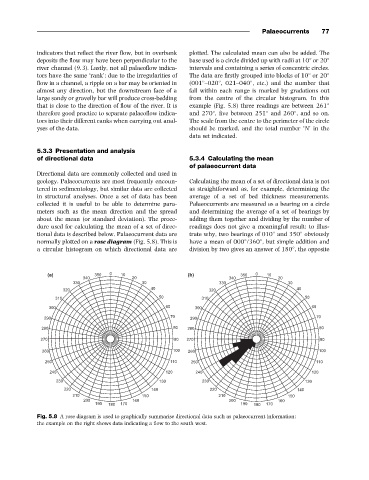
normally plotted on a rose diagram (Fig. 5.8). This is have a mean of 0008/3608, but simple addition and
a circular histogram on which directional data are division by two gives an answer of 1808, the opposite
86 6 6 86 6 6
6 6 6 6
6 6 6 6
6 6 6 6
6 86 6 86
66 56 66 56
F6 76 F6 76
G6 G6 G6 G6
76 F6 76 F6
56 66 56 66
86 6 86 6
6 6 6 6
6 6 6 6
6 6 6 6
6 86 6 86
66 56 66 56
F6 G6 76 F6 G6 76
Fig. 5.8 A rose diagram is used to graphically summarise directional data such as palaeocurrent information:
the example on the right shows data indicating a flow to the south west.