
Page 382 - Sensors and Control Systems in Manufacturing
P. 382
336
Se v e n
Cha p te r
Lens
Object Air purging Flexible jacket
Detector
Bundle fiber
Ridid jacket Output
FIGURE 7.8 Schematic diagram of an optical-fi ber pyrometer.
Optical-fiber pyrometers are one of the most successful optical-
fiber sensors in the field of process control in manufacturing. Typical
applications are:
• Casting and rolling lines in steel and other metal plants
• Electric welding and annealing
• Furnaces in chemical and metal plants
• Fusion, epitaxial growth, and sputtering processes in the
semiconductor industry
• Food processing, paper manufacturing, and plastic processing
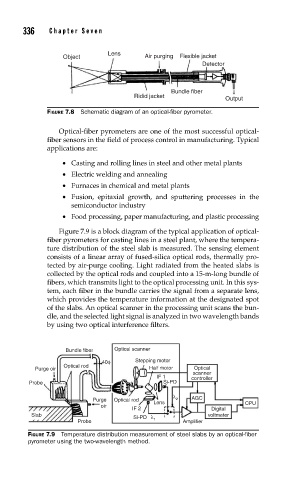
Figure 7.9 is a block diagram of the typical application of optical-
fiber pyrometers for casting lines in a steel plant, where the tempera-
ture distribution of the steel slab is measured. The sensing element
consists of a linear array of fused-silica optical rods, thermally pro-
tected by air-purge cooling. Light radiated from the heated slabs is
collected by the optical rods and coupled into a 15-m-long bundle of
fibers, which transmits light to the optical processing unit. In this sys-
tem, each fiber in the bundle carries the signal from a separate lens,
which provides the temperature information at the designated spot
of the slabs. An optical scanner in the processing unit scans the bun-
dle, and the selected light signal is analyzed in two wavelength bands
by using two optical interference filters.
Bundle fiber Optical scanner
40φ Stepping motor
Optical rod
Purge oir Half motor Optical
scanner
IF 1 controller
Probe Si-PD
λ AGC
Purge Optical rod Lens 2
oir CPU
IF 2 Digital
Slab Si-PD λ voltmeter
Probe 1 Amplifier
FIGURE 7.9 Temperature distribution measurement of steel slabs by an optical-fi ber
pyrometer using the two-wavelength method.