
Page 47 - Sensors and Control Systems in Manufacturing
P. 47
12
Cha p te r
R O n e R R 255
G–
R 80
W W R 80 W G200
B–
R+ B130
B+ R–
S B B S B 255
G+ B 130
G 200
G G G 255
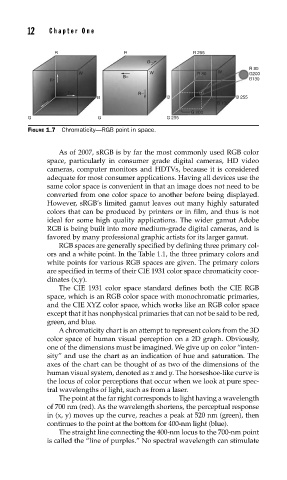
FIGURE 1.7 Chromaticity—RGB point in space.
As of 2007, sRGB is by far the most commonly used RGB color
space, particularly in consumer grade digital cameras, HD video
cameras, computer monitors and HDTVs, because it is considered
adequate for most consumer applications. Having all devices use the
same color space is convenient in that an image does not need to be
converted from one color space to another before being displayed.
However, sRGB’s limited gamut leaves out many highly saturated
colors that can be produced by printers or in film, and thus is not
ideal for some high quality applications. The wider gamut Adobe
RGB is being built into more medium-grade digital cameras, and is
favored by many professional graphic artists for its larger gamut.
RGB spaces are generally specified by defining three primary col-
ors and a white point. In the Table 1.1, the three primary colors and
white points for various RGB spaces are given. The primary colors
are specified in terms of their CIE 1931 color space chromaticity coor-
dinates (x,y).
The CIE 1931 color space standard defines both the CIE RGB
space, which is an RGB color space with monochromatic primaries,
and the CIE XYZ color space, which works like an RGB color space
except that it has nonphysical primaries that can not be said to be red,
green, and blue.
A chromaticity chart is an attempt to represent colors from the 3D
color space of human visual perception on a 2D graph. Obviously,
one of the dimensions must be imagined. We give up on color “inten-
sity” and use the chart as an indication of hue and saturation. The
axes of the chart can be thought of as two of the dimensions of the
human visual system, denoted as x and y. The horseshoe-like curve is
the locus of color perceptions that occur when we look at pure spec-
tral wavelengths of light, such as from a laser.
The point at the far right corresponds to light having a wavelength
of 700 nm (red). As the wavelength shortens, the perceptual response
in (x, y) moves up the curve, reaches a peak at 520 nm (green), then
continues to the point at the bottom for 400-nm light (blue).
The straight line connecting the 400-nm locus to the 700-nm point
is called the “line of purples.” No spectral wavelength can stimulate