
Page 636 - Sensors and Control Systems in Manufacturing
P. 636
400 450 500 550 600 650 700
Human Eye Sensitivity Chart
FIGURE 1.9 Visible light spectra.
THE VISIBLE SPECTRUM • Wavelength in Nanometers
400 450 500 550 600 650 700 800
(ultra) Violet Blue Cyan Green Yellow Orange Red Magenta (infra)
FIGURE 1.10 Visible ultraviolet light to red light spectra.
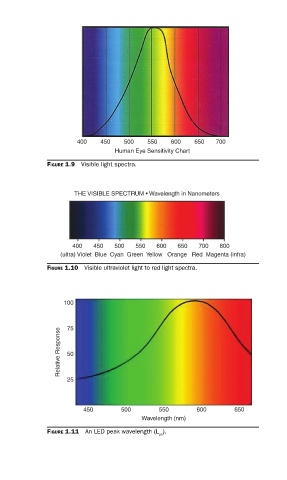
100
Relative Response 75
50
25
450 500 550 600 650
Wavelength (nm)
FIGURE 1.11 An LED peak wavelength (L ).
pk