Page 79 - Separation process engineering
P. 79

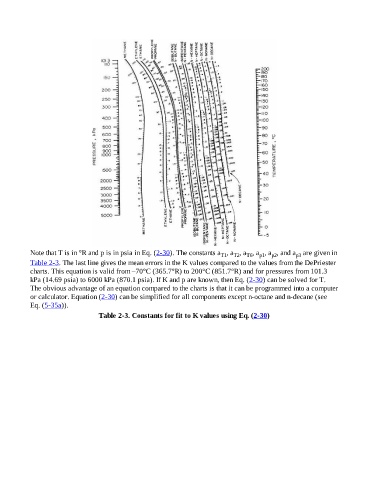
Note that T is in °R and p is in psia in Eq. (2-30). The constants a , a , a , a , a , and a  are given in
                                                                                                                  p2
                                                                                                                            p3
                                                                                              T1
                                                                                                         T6
                                                                                                   T2
                                                                                                              p1
                    Table 2-3. The last line gives the mean errors in the K values compared to the values from the DePriester
                    charts. This equation is valid from –70°C (365.7°R) to 200°C (851.7°R) and for pressures from 101.3
                    kPa (14.69 psia) to 6000 kPa (870.1 psia). If K and p are known, then Eq. (2-30) can be solved for T.
                    The obvious advantage of an equation compared to the charts is that it can be programmed into a computer
                    or calculator. Equation (2-30) can be simplified for all components except n-octane and n-decane (see
                    Eq. (5-35a)).
                                               Table 2-3. Constants for fit to K values using Eq. (2-30)
   74   75   76   77   78   79   80   81   82   83   84