
Page 156 - Serious Incident Prevention How to Achieve and Sustain Accident-Free Operations in Your Plant or Company
P. 156
CH12pp126-140 4/10/02 12:51 PM Page 131
Measurement and Feedback—Safety Performance Indexing 131
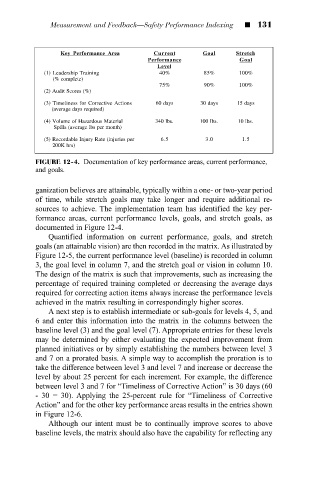
Key Performance Area Current Goal Stretch
Performance Goal
Level
(1) Leadership Training 40% 85% 100%
(% complete)
75% 90% 100%
(2) Audit Scores (%)
(3) Timeliness for Corrective Actions 60 days 30 days 15 days
(average days required)
(4) Volume of Hazardous Material 340 lbs. 100 lbs. 10 lbs.
Spills (average lbs per month)
(5) Recordable Injury Rate (injuries per 6.5 3.0 1.5
200K hrs)
FIGURE 12-4. Documentation of key performance areas, current performance,
and goals.
ganization believes are attainable, typically within a one- or two-year period
of time, while stretch goals may take longer and require additional re-
sources to achieve. The implementation team has identified the key per-
formance areas, current performance levels, goals, and stretch goals, as
documented in Figure 12-4.
Quantified information on current performance, goals, and stretch
goals (an attainable vision) are then recorded in the matrix. As illustrated by
Figure 12-5, the current performance level (baseline) is recorded in column
3, the goal level in column 7, and the stretch goal or vision in column 10.
The design of the matrix is such that improvements, such as increasing the
percentage of required training completed or decreasing the average days
required for correcting action items always increase the performance levels
achieved in the matrix resulting in correspondingly higher scores.
A next step is to establish intermediate or sub-goals for levels 4, 5, and
6 and enter this information into the matrix in the columns between the
baseline level (3) and the goal level (7). Appropriate entries for these levels
may be determined by either evaluating the expected improvement from
planned initiatives or by simply establishing the numbers between level 3
and 7 on a prorated basis. A simple way to accomplish the proration is to
take the difference between level 3 and level 7 and increase or decrease the
level by about 25 percent for each increment. For example, the difference
between level 3 and 7 for “Timeliness of Corrective Action” is 30 days (60
- 30 = 30). Applying the 25-percent rule for “Timeliness of Corrective
Action” and for the other key performance areas results in the entries shown
in Figure 12-6.
Although our intent must be to continually improve scores to above
baseline levels, the matrix should also have the capability for reflecting any