Page 99 - Harnessing the Strengths
P. 99

82  ■  Servant-Leadership in the Intercultural Practice


                  B:  If the individual is continuously taking
              care of his or her fellows, then the quality of life for
              us all will improve, even if it obstructs individual
              freedom and individual development.


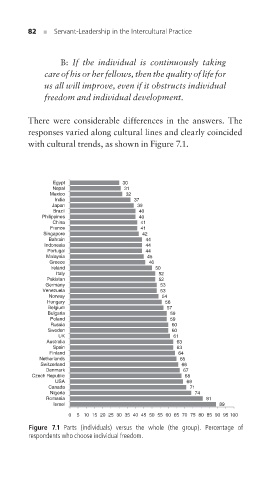
         There were considerable differences in the answers. The
         responses varied along cultural lines and clearly coincided
         with cultural trends, as shown in Figure 7.1.


                Egypt             30
                Nepal             31
               Mexico              32
                India                37
                Japan                 39
                Brazil                40
             Philippines              40
                China                 41
               France                 41
             Singapore                 42
               Bahrain                  44
              Indonesia                 44
              Portugal                  44
              Malaysia                  45
               Greece                    46
               Ireland                    50
                 Italy                     52
              Pakistan                     52
              G Germany                    53
             Venezuela                     53
               Norway                       54
              Hungary                        56
              Belgium                        57
              Bulgaria                        59
               Poland                         59
               Russia                         60
               Sweden                         60
                 UK                            61
              Australia                         63
                Spain                           63
               Finland                          64
            Netherlands                          65
             Switzerland                         66
              Denmark                            67
          Czech Republic                          68
                USA                               69
               Canada                              71
               Nigeria                              74
              Romania                                  81
                Israel                                     89
                    0  5 10 15 20 25 30 35 40 45 50 55 60 65 70 75 80 85 90 95 100
          Figure 7.1  Parts (individuals) versus the whole (the group). Percentage of
          respondents who choose individual freedom.
   94   95   96   97   98   99   100   101   102   103   104