
Page 69 - Shigley's Mechanical Engineering Design
P. 69
bud29281_ch02_031-070.qxd 11/11/09 09:34 PM Page 44 Debd Hard Disk1:Desktop Folder:Temp Work:Satya 10/11/09:
44 Mechanical Engineering Design
Figure 2–9
1.0
A plot of the results of 145 tests S ut
of 21 carbon and alloy steels
0.9
showing the effect of operating
temperature on the yield S y
S T /S RT
strength S y and the ultimate 0.8
strength S ut . The ordinate is
the ratio of the strength at the 0.7
operating temperature to the
strength at room temperature. 0.6
The standard deviations were
0.0442 ≤ˆσ Sy ≤ 0.152 for S y
0.5
and 0.099 ≤ˆσ Sut ≤ 0.11 for 0 RT 200 400 600
S ut . (Data source: E. A. Temperature, °C
Brandes (ed.), Smithells Metal
Reference Book, 6th ed.,
only a small amount until a certain temperature is reached. At that point it falls off
Butterworth, London, 1983
rapidly. The yield strength, however, decreases continuously as the environmental tem-
pp. 22–128 to 22–131.)
perature is increased. There is a substantial increase in ductility, as might be expected,
at the higher temperatures.
Many tests have been made of ferrous metals subjected to constant loads for long
periods of time at elevated temperatures. The specimens were found to be permanently
deformed during the tests, even though at times the actual stresses were less than the
yield strength of the material obtained from short-time tests made at the same temper-
ature. This continuous deformation under load is called creep.
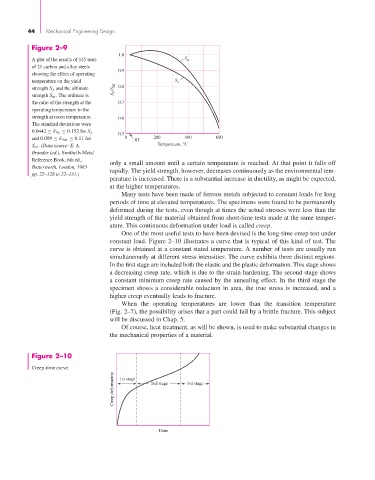
One of the most useful tests to have been devised is the long-time creep test under
constant load. Figure 2–10 illustrates a curve that is typical of this kind of test. The
curve is obtained at a constant stated temperature. A number of tests are usually run
simultaneously at different stress intensities. The curve exhibits three distinct regions.
In the first stage are included both the elastic and the plastic deformation. This stage shows
a decreasing creep rate, which is due to the strain hardening. The second stage shows
a constant minimum creep rate caused by the annealing effect. In the third stage the
specimen shows a considerable reduction in area, the true stress is increased, and a
higher creep eventually leads to fracture.
When the operating temperatures are lower than the transition temperature
(Fig. 2–7), the possibility arises that a part could fail by a brittle fracture. This subject
will be discussed in Chap. 5.
Of course, heat treatment, as will be shown, is used to make substantial changes in
the mechanical properties of a material.
Figure 2–10
Creep-time curve. 1st stage
Creep deformation 2nd stage 3rd stage
Time