
Page 68 - Shigley's Mechanical Engineering Design
P. 68
bud29281_ch02_031-070.qxd 11/11/09 09:33 PM Page 43 Debd Hard Disk1:Desktop Folder:Temp Work:Satya 10/11/09:
Materials 43
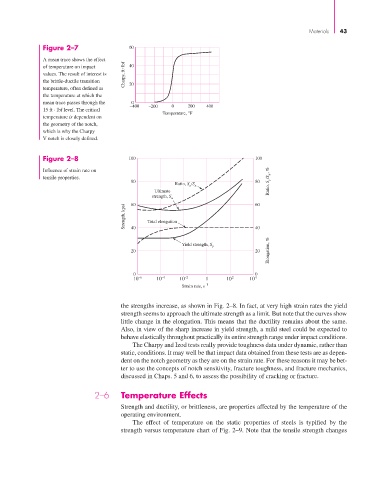
Figure 2–7 60
A mean trace shows the effect
of temperature on impact 40
values. The result of interest is Charpy, ft lbf
the brittle-ductile transition 20
temperature, often defined as
the temperature at which the
mean trace passes through the 0
–400 –200 0 200 400
15 ft · lbf level. The critical
Temperature, °F
temperature is dependent on
the geometry of the notch,
which is why the Charpy
V notch is closely defined.
Figure 2–8 100 100
Influence of strain rate on
tensile properties.
80 80 Ratio, S y /S u , %
Ratio, S /S u
y
Ultimate
strength, S u 60
60
Strength, kpsi 40 Total elongation 40
Yield strength, S y
20 20 Elongation, %
0 0
10 –6 10 –4 10 –2 1 10 2 10 4
Strain rate, s –1
the strengths increase, as shown in Fig. 2–8. In fact, at very high strain rates the yield
strength seems to approach the ultimate strength as a limit. But note that the curves show
little change in the elongation. This means that the ductility remains about the same.
Also, in view of the sharp increase in yield strength, a mild steel could be expected to
behave elastically throughout practically its entire strength range under impact conditions.
The Charpy and Izod tests really provide toughness data under dynamic, rather than
static, conditions. It may well be that impact data obtained from these tests are as depen-
dent on the notch geometry as they are on the strain rate. For these reasons it may be bet-
ter to use the concepts of notch sensitivity, fracture toughness, and fracture mechanics,
discussed in Chaps. 5 and 6, to assess the possibility of cracking or fracture.
2–6 Temperature Effects
Strength and ductility, or brittleness, are properties affected by the temperature of the
operating environment.
The effect of temperature on the static properties of steels is typified by the
strength versus temperature chart of Fig. 2–9. Note that the tensile strength changes