
Page 63 - Shigley's Mechanical Engineering Design
P. 63
bud29281_ch02_031-070.qxd 11/11/09 09:33 PM Page 38 Debd Hard Disk1:Desktop Folder:Temp Work:Satya 10/11/09:
38 Mechanical Engineering Design
mean, standard deviation, and distribution type. Many tables display a single number,
which is often the mean, minimum, or some percentile, such as the 99th percentile.
Always read the foonotes to the table. If no qualification is made in a single-entry table,
the table is subject to serious doubt.
Since it is no surprise that useful descriptions of a property are statistical in nature,
engineers, when ordering property tests, should couch the instructions so the data gen-
erated are enough for them to observe the statistical parameters and to identify the dis-
tributional characteristic. The tensile test program on 1000 specimens of 1020 steel is
a large one. If you were faced with putting something in a table of ultimate tensile
strengths and constrained to a single number, what would it be and just how would your
footnote read?
2–3 Strength and Cold Work
Cold working is the process of plastic straining below the recrystallization temperature
in the plastic region of the stress-strain diagram. Materials can be deformed plastically
by the application of heat, as in forging or hot rolling, but the resulting mechanical
properties are quite different from those obtained by cold working. The purpose of this
section is to explain what happens to the significant mechanical properties of a material
when that material is cold worked.
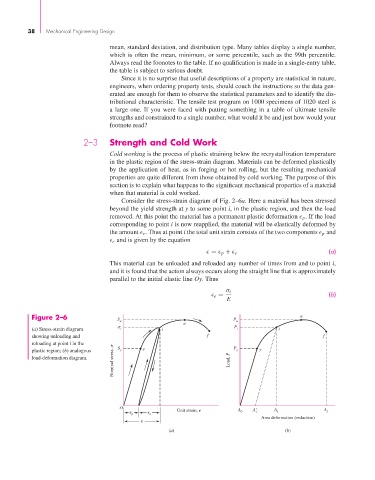
Consider the stress-strain diagram of Fig. 2–6a. Here a material has been stressed
beyond the yield strength at y to some point i, in the plastic region, and then the load
removed. At this point the material has a permanent plastic deformation p . If the load
corresponding to point i is now reapplied, the material will be elastically deformed by
the amount e . Thus at point i the total unit strain consists of the two components p and
e and is given by the equation
(a)
= p + e
This material can be unloaded and reloaded any number of times from and to point i,
and it is found that the action always occurs along the straight line that is approximately
parallel to the initial elastic line Oy. Thus
σ i
e = (b)
E
Figure 2–6 S P u
u
u u
(a) Stress-strain diagram i i P i i
showing unloading and f f
reloading at point i in the
Nominal stress, Load, P
plastic region; (b) analogous S y y P y y
load-deformation diagram.
O A A A A
p e Unit strain, 0 i i f
Area deformation (reduction)
(a) (b)