
Page 59 - Shigley's Mechanical Engineering Design
P. 59
bud29281_ch02_031-070.qxd 11/11/09 09:32 PM Page 34 Debd Hard Disk1:Desktop Folder:Temp Work:Satya 10/11/09:
34 Mechanical Engineering Design
some materials exhibit a downward trend after the maximum stress is reached and frac-
ture at point f on the diagram. Others, such as some of the cast irons and high-strength
steels, fracture while the stress-strain trace is still rising, as shown in Fig. 2–2b, where
points u and f are identical.
As noted in Sec. 1–9, strength, as used in this book, is a built-in property of a mate-
rial, or of a mechanical element, because of the selection of a particular material or
process or both. The strength of a connecting rod at the critical location in the geome-
try and condition of use, for example, is the same no matter whether it is already an ele-
ment in an operating machine or whether it is lying on a workbench awaiting assembly
with other parts. On the other hand, stress is something that occurs in a part, usually as
a result of its being assembled into a machine and loaded. However, stresses may be
built into a part by processing or handling. For example, shot peening produces a com-
pressive stress in the outer surface of a part, and also improves the fatigue strength of
the part. Thus, in this book we will be very careful in distinguishing between strength,
designated by S, and stress, designated by σ or τ.
The diagrams in Fig. 2–2 are called engineering stress-strain diagrams because the
stresses and strains calculated in Eqs. (2–1) and (2–2) are not true values. The stress
calculated in Eq. (2–1) is based on the original area before the load is applied. In real-
ity, as the load is applied the area reduces so that the actual or true stress is larger than
the engineering stress. To obtain the true stress for the diagram the load and the cross-
sectional area must be measured simultaneously during the test. Figure 2–2a represents
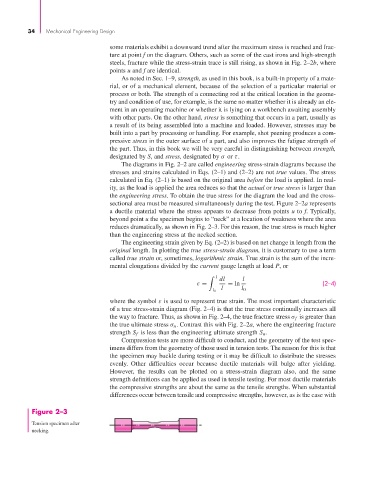
a ductile material where the stress appears to decrease from points u to f. Typically,
beyond point u the specimen begins to “neck” at a location of weakness where the area
reduces dramatically, as shown in Fig. 2–3. For this reason, the true stress is much higher
than the engineering stress at the necked section.
The engineering strain given by Eq. (2–2) is based on net change in length from the
original length. In plotting the true stress-strain diagram, it is customary to use a term
called true strain or, sometimes, logarithmic strain. True strain is the sum of the incre-
mental elongations divided by the current gauge length at load P, or
l
dl l
ε = = ln (2–4)
l l 0
l 0
where the symbol ε is used to represent true strain. The most important characteristic
of a true stress-strain diagram (Fig. 2–4) is that the true stress continually increases all
the way to fracture. Thus, as shown in Fig. 2–4, the true fracture stress σ f is greater than
the true ultimate stress σ u . Contrast this with Fig. 2–2a, where the engineering fracture
strength S f is less than the engineering ultimate strength S u .
Compression tests are more difficult to conduct, and the geometry of the test spec-
imens differs from the geometry of those used in tension tests. The reason for this is that
the specimen may buckle during testing or it may be difficult to distribute the stresses
evenly. Other difficulties occur because ductile materials will bulge after yielding.
However, the results can be plotted on a stress-strain diagram also, and the same
strength definitions can be applied as used in tensile testing. For most ductile materials
the compressive strengths are about the same as the tensile strengths. When substantial
differences occur between tensile and compressive strengths, however, as is the case with
Figure 2–3
Tension specimen after
necking.