
Page 60 - Shigley's Mechanical Engineering Design
P. 60
bud29281_ch02_031-070.qxd 11/11/09 09:32 PM Page 35 Debd Hard Disk1:Desktop Folder:Temp Work:Satya 10/11/09:
Materials 35
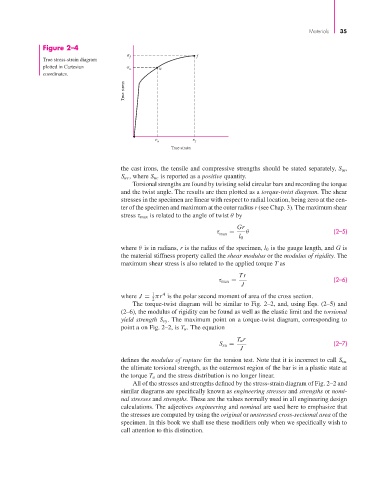
Figure 2–4
f
True stress-strain diagram f
plotted in Cartesian u u
coordinates.
True stress
u f
True strain
the cast irons, the tensile and compressive strengths should be stated separately, S ut,
S uc , where S uc is reported as a positive quantity.
Torsional strengths are found by twisting solid circular bars and recording the torque
and the twist angle. The results are then plotted as a torque-twist diagram. The shear
stresses in the specimen are linear with respect to radial location, being zero at the cen-
ter of the specimen and maximum at the outer radius r (see Chap. 3). The maximum shear
stress τ max is related to the angle of twist θ by
Gr
τ = θ (2–5)
max
l 0
where θ is in radians, r is the radius of the specimen, l 0 is the gauge length, and G is
the material stiffness property called the shear modulus or the modulus of rigidity. The
maximum shear stress is also related to the applied torque T as
Tr
τ max = (2–6)
J
1
4
where J = πr is the polar second moment of area of the cross section.
2
The torque-twist diagram will be similar to Fig. 2–2, and, using Eqs. (2–5) and
(2–6), the modulus of rigidity can be found as well as the elastic limit and the torsional
yield strength S sy . The maximum point on a torque-twist diagram, corresponding to
point u on Fig. 2–2, is T u . The equation
T u r
S su = (2–7)
J
defines the modulus of rupture for the torsion test. Note that it is incorrect to call S su
the ultimate torsional strength, as the outermost region of the bar is in a plastic state at
the torque T u and the stress distribution is no longer linear.
All of the stresses and strengths defined by the stress-strain diagram of Fig. 2–2 and
similar diagrams are specifically known as engineering stresses and strengths or nomi-
nal stresses and strengths. These are the values normally used in all engineering design
calculations. The adjectives engineering and nominal are used here to emphasize that
the stresses are computed by using the original or unstressed cross-sectional area of the
specimen. In this book we shall use these modifiers only when we specifically wish to
call attention to this distinction.