
Page 58 - Shigley's Mechanical Engineering Design
P. 58
bud29281_ch02_031-070.qxd 11/12/2009 7:59 pm Page 33 pinnacle s-171:Desktop Folder:Temp Work:Don't Delete (Jobs):MHDQ196/Budynas:
Materials 33
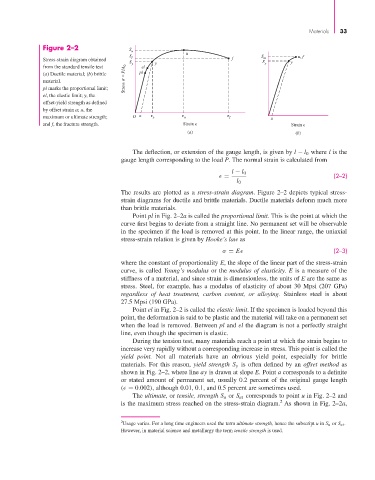
Figure 2–2 S u
S u S u, f
Stress-strain diagram obtained f f ut
S y y S y y
from the standard tensile test el
(a) Ductile material; (b) brittle pl
material. Stress = P/A 0
pl marks the proportional limit;
el, the elastic limit; y, the
offset-yield strength as defined
by offset strain a; u, the
maximum or ultimate strength; O a y u f a
and f, the fracture strength. Strain Strain
(a) (b)
The deflection, or extension of the gauge length, is given by l − l 0 where l is the
gauge length corresponding to the load P. The normal strain is calculated from
l − l 0
= (2–2)
l 0
The results are plotted as a stress-strain diagram. Figure 2–2 depicts typical stress-
strain diagrams for ductile and brittle materials. Ductile materials deform much more
than brittle materials.
Point pl in Fig. 2–2a is called the proportional limit. This is the point at which the
curve first begins to deviate from a straight line. No permanent set will be observable
in the specimen if the load is removed at this point. In the linear range, the uniaxial
stress-strain relation is given by Hooke’s law as
σ = E (2–3)
where the constant of proportionality E, the slope of the linear part of the stress-strain
curve, is called Young’s modulus or the modulus of elasticity. E is a measure of the
stiffness of a material, and since strain is dimensionless, the units of E are the same as
stress. Steel, for example, has a modulus of elasticity of about 30 Mpsi (207 GPa)
regardless of heat treatment, carbon content, or alloying. Stainless steel is about
27.5 Mpsi (190 GPa).
Point el in Fig. 2–2 is called the elastic limit. If the specimen is loaded beyond this
point, the deformation is said to be plastic and the material will take on a permanent set
when the load is removed. Between pl and el the diagram is not a perfectly straight
line, even though the specimen is elastic.
During the tension test, many materials reach a point at which the strain begins to
increase very rapidly without a corresponding increase in stress. This point is called the
yield point. Not all materials have an obvious yield point, especially for brittle
materials. For this reason, yield strength S y is often defined by an offset method as
shown in Fig. 2–2, where line ay is drawn at slope E. Point a corresponds to a definite
or stated amount of permanent set, usually 0.2 percent of the original gauge length
( = 0.002), although 0.01, 0.1, and 0.5 percent are sometimes used.
The ultimate, or tensile, strength S u or S ut corresponds to point u in Fig. 2–2 and
2
is the maximum stress reached on the stress-strain diagram. As shown in Fig. 2–2a,
2 Usage varies. For a long time engineers used the term ultimate strength, hence the subscript u in S u or S ut .
However, in material science and metallurgy the term tensile strength is used.