
Page 84 - Silence in Intercultural Communication
P. 84
Chapter 4. Perceptions of silence 71
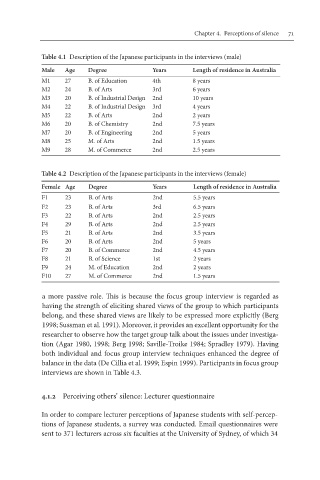
Table 4.1 Description of the Japanese participants in the interviews (male)
Male Age Degree Years Length of residence in Australia
M1 27 B. of Education 4th 8 years
M2 24 B. of Arts 3rd 6 years
M3 20 B. of Industrial Design 2nd 10 years
M4 22 B. of Industrial Design 3rd 4 years
M5 22 B. of Arts 2nd 2 years
M6 20 B. of Chemistry 2nd 7.5 years
M7 20 B. of Engineering 2nd 5 years
M8 25 M. of Arts 2nd 1.5 years
M9 28 M. of Commerce 2nd 2.5 years
Table 4.2 Description of the Japanese participants in the interviews (female)
Female Age Degree Years Length of residence in Australia
F1 23 B. of Arts 2nd 5.5 years
F2 23 B. of Arts 3rd 6.5 years
F3 22 B. of Arts 2nd 2.5 years
F4 29 B. of Arts 2nd 2.5 years
F5 21 B. of Arts 2nd 3.5 years
F6 20 B. of Arts 2nd 5 years
F7 20 B. of Commerce 2nd 4.5 years
F8 21 B. of Science 1st 2 years
F9 24 M. of Education 2nd 2 years
F10 27 M. of Commerce 2nd 1.5 years
a more passive role. This is because the focus group interview is regarded as
having the strength of eliciting shared views of the group to which participants
belong, and these shared views are likely to be expressed more explicitly (Berg
1998; Sussman et al. 1991). Moreover, it provides an excellent opportunity for the
researcher to observe how the target group talk about the issues under investiga-
tion (Agar 1980, 1998; Berg 1998; Saville-Troike 1984; Spradley 1979). Having
both individual and focus group interview techniques enhanced the degree of
balance in the data (De Cillia et al. 1999; Espin 1999). Participants in focus group
interviews are shown in Table 4.3.
4.1.2 Perceiving others’ silence: Lecturer questionnaire
In order to compare lecturer perceptions of Japanese students with self-percep-
tions of Japanese students, a survey was conducted. Email questionnaires were
sent to 371 lecturers across six faculties at the University of Sydney, of which 34