
Page 152 -
P. 152
8 The Importance of Ontological Structure: Why Validation by ‘Fit-to-Data’... 149
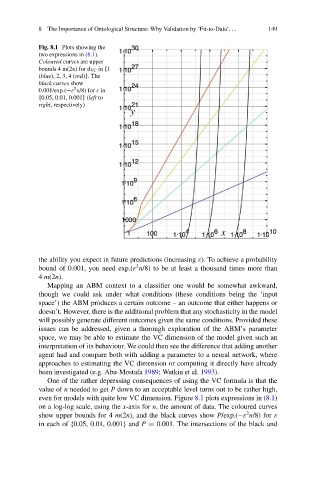
Fig. 8.1 Plots showing the
two expressions in (8.1).
Coloured curves are upper
bounds 4 m(2x) for d VC in f1
(blue), 2, 3, 4 (red)g.The
black curves show
2
0.001/exp.( " x/8) for " in
f0.05, 0.01, 0.001g (left to
right, respectively)
the ability you expect in future predictions (increasing "). To achieve a probability
2
bound of 0.001, you need exp.(" n/8) to be at least a thousand times more than
4 m(2n).
Mapping an ABM context to a classifier one would be somewhat awkward,
though we could ask under what conditions (these conditions being the ‘input
space’) the ABM produces a certain outcome – an outcome that either happens or
doesn’t. However, there is the additional problem that any stochasticity in the model
will possibly generate different outcomes given the same conditions. Provided these
issues can be addressed, given a thorough exploration of the ABM’s parameter
space, we may be able to estimate the VC dimension of the model given such an
interpretation of its behaviour. We could then see the difference that adding another
agent had and compare both with adding a parameter to a neural network, where
approaches to estimating the VC dimension or computing it directly have already
been investigated (e.g. Abu-Mostafa 1989; Watkin et al. 1993).
One of the rather depressing consequences of using the VC formula is that the
value of n needed to get P down to an acceptable level turns out to be rather high,
even for models with quite low VC dimension. Figure 8.1 plots expressions in (8.1)
on a log-log scale, using the x-axis for n, the amount of data. The coloured curves
2
show upper bounds for 4 m(2n), and the black curves show P/exp.( " n/8) for "
in each of f0.05, 0.01, 0.001g and P D 0.001. The intersections of the black and