
Page 235 -
P. 235
11 How Many Times Should One Run a Computational Simulation? 233
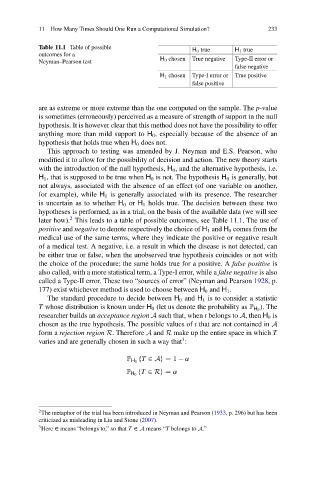
Table 11.1 Table of possible H 0 true H 1 true
outcomes for a
Neyman–Pearson test H 0 chosen True negative Type-II error or
false negative
H 1 chosen Type-I error or True positive
false positive
are as extreme or more extreme than the one computed on the sample. The p-value
is sometimes (erroneously) perceived as a measure of strength of support in the null
hypothesis. It is however clear that this method does not have the possibility to offer
anything more than mild support to H 0 , especially because of the absence of an
hypothesis that holds true when H 0 does not.
This approach to testing was amended by J. Neyman and E.S. Pearson, who
modified it to allow for the possibility of decision and action. The new theory starts
with the introduction of the null hypothesis, H 0 , and the alternative hypothesis, i.e.
H 1 , that is supposed to be true when H 0 is not. The hypothesis H 0 is generally, but
not always, associated with the absence of an effect (of one variable on another,
for example), while H 1 is generally associated with its presence. The researcher
is uncertain as to whether H 0 or H 1 holds true. The decision between these two
hypotheses is performed, as in a trial, on the basis of the available data (we will see
2
later how). This leads to a table of possible outcomes, see Table 11.1. The use of
positive and negative to denote respectively the choice of H 1 and H 0 comes from the
medical use of the same terms, where they indicate the positive or negative result
of a medical test. A negative, i.e. a result in which the disease is not detected, can
be either true or false, when the unobserved true hypothesis coincides or not with
the choice of the procedure; the same holds true for a positive. A false positive is
also called, with a more statistical term, a Type-I error, while a false negative is also
called a Type-II error. These two “sources of error” (Neyman and Pearson 1928,p.
177) exist whichever method is used to choose between H 0 and H 1 .
The standard procedure to decide between H 0 and H 1 is to consider a statistic
). The
T whose distribution is known under H 0 (let us denote the probability as P H 0
researcher builds an acceptance region A such that, when t belongs to A, then H 0 is
chosen as the true hypothesis. The possible values of t that are not contained in A
form a rejection region R. Therefore A and R make up the entire space in which T
3
varies and are generally chosen in such a way that :
fT 2 Ag D 1 ˛
P H 0
fT 2 Rg D ˛
P H 0
2
The metaphor of the trial has been introduced in Neyman and Pearson (1933, p. 296) but has been
criticized as misleading in Liu and Stone (2007).
3 Here 2 means “belongs to,” so that T 2 A means “T belongs to A.”