
Page 249 - Six Sigma Demystified
P. 249
Part 3 s i x s i g m a to o l s 229
Poisson Distribution
The Poisson distribution is used to estimate the number of times a condition
occurs in a process or population, where the condition may occur multiple
times in a given sample unit. For example, if the population is the total
number of orders shipped in July, the condition of interest might be the
number of errors on the invoices. Note how this is different from the bino-
mial estimate of the process error rate because each invoice can have more
than one error. When counting the number of occurrences within each sam-
ple unit, the Poisson distribution is appropriate for modeling the total num-
ber of occurrences. Each trial is independent of others, and the data are
positive integers.
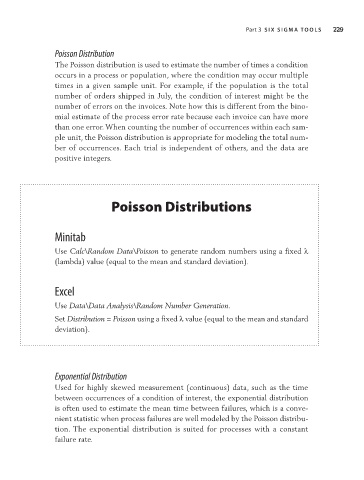
Poisson Distributions
Minitab
Use Calc\Random Data\Poisson to generate random numbers using a fixed λ
(lambda) value (equal to the mean and standard deviation).
Excel
Use Data\Data Analysis\Random Number Generation.
Set Distribution = Poisson using a fixed λ value (equal to the mean and standard
deviation).
Exponential Distribution
Used for highly skewed measurement (continuous) data, such as the time
between occurrences of a condition of interest, the exponential distribution
is often used to estimate the mean time between failures, which is a conve-
nient statistic when process failures are well modeled by the Poisson distribu-
tion. The exponential distribution is suited for processes with a constant
failure rate.