
Page 255 - Six Sigma Demystified
P. 255
Part 3 s i x s i g m a to o l s 235
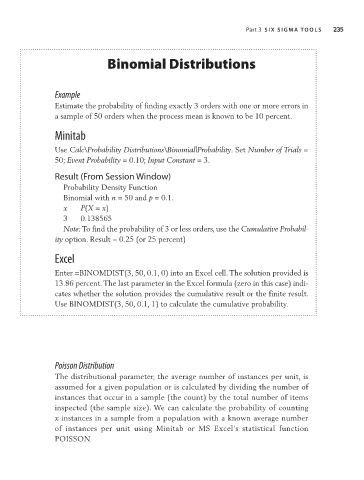
Binomial Distributions
Example
Estimate the probability of finding exactly 3 orders with one or more errors in
a sample of 50 orders when the process mean is known to be 10 percent.
Minitab
Use Calc\Probability Distributions\Binomial|Probability. Set Number of Trials =
50; Event Probability = 0.10; Input Constant = 3.
Result (From Session Window)
Probability Density Function
Binomial with n = 50 and p = 0.1.
x P(X = x)
3 0.138565
Note: To find the probability of 3 or less orders, use the Cumulative Probabil-
ity option. Result = 0.25 (or 25 percent)
Excel
Enter =BINOMDIST(3, 50, 0.1, 0) into an Excel cell. The solution provided is
13.86 percent. The last parameter in the Excel formula (zero in this case) indi-
cates whether the solution provides the cumulative result or the finite result.
Use BINOMDIST(3, 50, 0.1, 1) to calculate the cumulative probability.
Poisson Distribution
The distributional parameter, the average number of instances per unit, is
assumed for a given population or is calculated by dividing the number of
instances that occur in a sample (the count) by the total number of items
inspected (the sample size). We can calculate the probability of counting
x instances in a sample from a population with a known average number
of instances per unit using Minitab or MS Excel’s statistical function
POISSON.