
Page 259 - Six Sigma Demystified
P. 259
Part 3 s i x s i g m a to o l s 239
Johnson Distributions
When the convenience of known distributions such as the normal or exponential
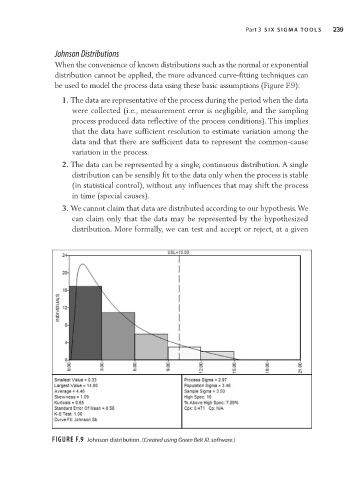
distribution cannot be applied, the more advanced curve-fitting techniques can
be used to model the process data using these basic assumptions (Figure F.9):
1. The data are representative of the process during the period when the data
were collected (i.e., measurement error is negligible, and the sampling
process produced data reflective of the process conditions). This implies
that the data have sufficient resolution to estimate variation among the
data and that there are sufficient data to represent the common-cause
variation in the process.
2. The data can be represented by a single, continuous distribution. A single
distribution can be sensibly fit to the data only when the process is stable
(in statistical control), without any influences that may shift the process
in time (special causes).
3. We cannot claim that data are distributed according to our hypothesis. We
can claim only that the data may be represented by the hypothesized
distribution. More formally, we can test and accept or reject, at a given
Figure F.9 Johnson distribution. (Created using Green Belt XL software.)