
Page 262 - Six Sigma Demystified
P. 262
242 Six SigMa DemystifieD
Equality of Variance
Minitab
Use Stat\ANOVA\Test for Equal Variances. Select the response column, then
select the factors that are considered significant for the model.
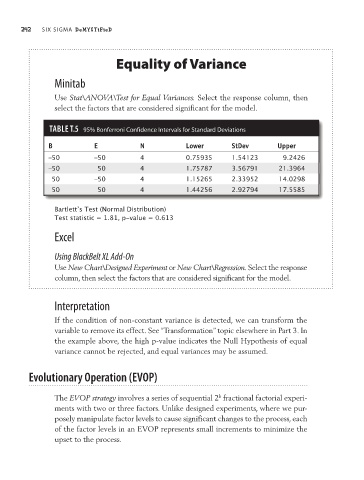
TAble T.5 95% Bonferroni Confidence intervals for Standard Deviations
B E N Lower StDev Upper
–50 –50 4 0.75935 1.54123 9.2426
–50 50 4 1.75787 3.56791 21.3964
50 –50 4 1.15265 2.33952 14.0298
50 50 4 1.44256 2.92794 17.5585
Bartlett’s Test (Normal Distribution)
Test statistic = 1.81, p-value = 0.613
Excel
Using BlackBelt XL Add-On
Use New Chart\Designed Experiment or New Chart\Regression. Select the response
column, then select the factors that are considered significant for the model.
Interpretation
If the condition of non-constant variance is detected, we can transform the
vari able to remove its effect. See “Transformation” topic elsewhere in Part 3. In
the example above, the high p-value indicates the Null Hypothesis of equal
variance cannot be rejected, and equal variances may be assumed.
evolutionary Operation (eVOP)
k
The EVOP strategy involves a series of sequential 2 fractional factorial experi-
ments with two or three factors. Unlike designed experiments, where we pur-
posely manipulate factor levels to cause significant changes to the process, each
of the factor levels in an EVOP represents small increments to minimize the
upset to the process.