
Page 265 - Six Sigma Demystified
P. 265
Part 3 s i x s i g m a to o l s 245
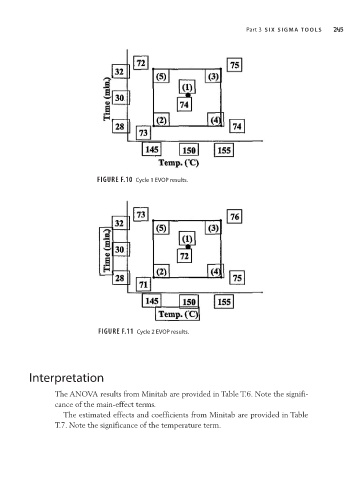
Figure F.10 Cycle 1 EVOP results.
Figure F.11 Cycle 2 EVOP results.
interpretation
The ANOVA results from Minitab are provided in Table T.6. Note the signifi-
cance of the main-effect terms.
The estimated effects and coefficients from Minitab are provided in Table
T.7. Note the significance of the temperature term.