
Page 266 - Six Sigma Demystified
P. 266
246 Six SigMa DemystifieD
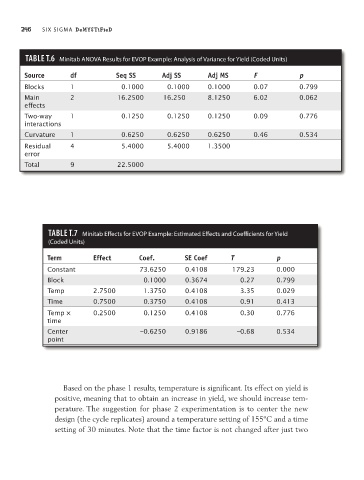
TAble T.6 Minitab aNOVa Results for EVOP Example: analysis of Variance for Yield (Coded units)
Source df Seq SS Adj SS Adj MS F p
Blocks 1 0.1000 0.1000 0.1000 0.07 0.799
Main 2 16.2500 16.250 8.1250 6.02 0.062
effects
Two-way 1 0.1250 0.1250 0.1250 0.09 0.776
interactions
Curvature 1 0.6250 0.6250 0.6250 0.46 0.534
Residual 4 5.4000 5.4000 1.3500
error
Total 9 22.5000
TAble T.7 Minitab Effects for EVOP Example: Estimated Effects and Coefficients for Yield
(Coded units)
Term Effect Coef. SE Coef T p
Constant 73.6250 0.4108 179.23 0.000
Block 0.1000 0.3674 0.27 0.799
Temp 2.7500 1.3750 0.4108 3.35 0.029
Time 0.7500 0.3750 0.4108 0.91 0.413
Temp × 0.2500 0.1250 0.4108 0.30 0.776
time
Center –0.6250 0.9186 –0.68 0.534
point
Based on the phase 1 results, temperature is significant. Its effect on yield is
positive, meaning that to obtain an increase in yield, we should increase tem-
perature. The suggestion for phase 2 experimentation is to center the new
design (the cycle replicates) around a temperature setting of 155ºC and a time
setting of 30 minutes. Note that the time factor is not changed after just two