
Page 78 - Six Sigma Demystified
P. 78
Chapter 3 f o c u s i n g t h e d e p loy m e n t 59
Table 3.1 Pareto Priority index Calculationss
Project Saving Probability Cost Completion PPI
($000) of Success ($000) Time
PO cycle 220 90% 5 3.5 11.3
time months
Shipping 40 70% 9 6 months 5.2
damage
Design 770 50% 30 10 months 1.28
change
the first project, PO (purchase order) cycle time, has the lowest projected sav-
ings, it is the preferred project, receiving the highest PPI score. This reflects its
overall reduced risk (with higher probability of success and lower cost to
deploy).
Although the PPI is relatively easy to use, it ignores many potential project
benefits, such as the ability to meet shipment schedules, reduce inventories, or
contribute to strategic business- or customer- valued objectives.
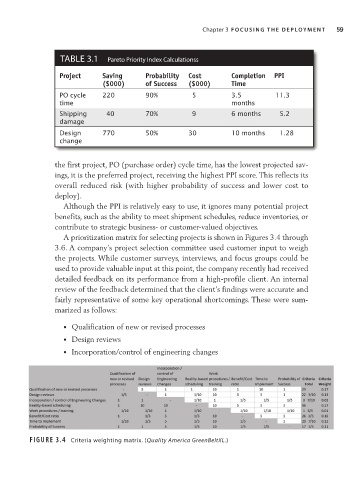
A prioritization matrix for selecting projects is shown in Figures 3.4 through
3.6. A company’s project selection committee used customer input to weigh
the projects. While customer surveys, interviews, and focus groups could be
used to provide valuable input at this point, the company recently had received
detailed feedback on its performance from a high- profile client. An internal
review of the feedback determined that the client’s findings were accurate and
fairly representative of some key operational shortcomings. These were sum-
marized as follows:
• Qualification of new or revised processes
• Design reviews
• Incorporation/control of engineering changes
Figure 3.4 Criteria weighting matrix. (Quality America GreenBeltXL.)