
Page 79 - Six Sigma Demystified
P. 79
60 Six SigMa DemystifieD
• Reality- based scheduling
• Work procedures/training
The company added three more criteria for project selection: benefit- cost
ratio, time to implement, and probability of success. All these objectives were
compared with one another and rated for relative importance by senior man-
agement. The results are shown in the criteria weights matrix in Figure 3.4. A
value of 1 means that the two criteria are equal in importance, a value of 10
implies that the row is significantly more important than the column, and a
value of 5 implies that the row is somewhat more important.
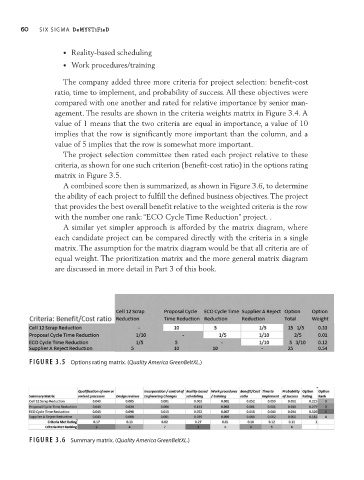
The project selection committee then rated each project relative to these
criteria, as shown for one such criterion (benefit- cost ratio) in the options rating
matrix in Figure 3.5.
A combined score then is summarized, as shown in Figure 3.6, to determine
the ability of each project to fulfill the defined business objectives. The project
that provides the best overall benefit relative to the weighted criteria is the row
with the number one rank: “ECO Cycle Time Reduction” project. .
A similar yet simpler approach is afforded by the matrix diagram, where
each candidate project can be compared directly with the criteria in a single
matrix. The assumption for the matrix diagram would be that all criteria are of
equal weight. The prioritization matrix and the more general matrix diagram
are discussed in more detail in Part 3 of this book.
Figure 3.5 Options rating matrix. (Quality America GreenBeltXL.)
Figure 3.6 Summary matrix. (Quality America GreenBeltXL.)