
Page 210 - Six Sigma for electronics design and manufacturing
P. 210
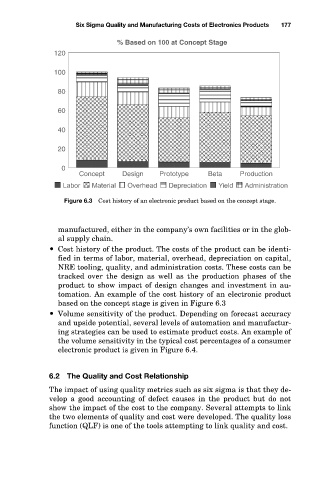
% Based on 100 at Concept Stage
                         120
                         100
                          80
                          60
                          40  Six Sigma Quality and Manufacturing Costs of Electronics Products  177
                          20
                           0
                               Concept   Design   Prototype   Beta   Production

                           Figure 6.3 Cost history of an electronic product based on the concept stage.


                          manufactured, either in the company’s own facilities or in the glob-
                          al supply chain.
                          Cost history of the product. The costs of the product can be identi-
                          fied in terms of labor, material, overhead, depreciation on capital,
                          NRE tooling, quality, and administration costs. These costs can be
                          tracked  over  the  design  as  well  as  the  production  phases  of  the
                          product to show impact of design changes and investment in au-
                          tomation. An example of the cost history of an electronic product
                          based on the concept stage is given in Figure 6.3
                          Volume sensitivity of the product. Depending on forecast accuracy
                          and upside potential, several levels of automation and manufactur-
                          ing strategies can be used to estimate product costs. An example of
                          the volume sensitivity in the typical cost percentages of a consumer
                          electronic product is given in Figure 6.4.


                        6.2  The Quality and Cost Relationship
                        The impact of using quality metrics such as six sigma is that they de-
                        velop  a  good  accounting  of  defect  causes  in  the  product  but  do  not
                        show the impact of the cost to the company. Several attempts to link
                        the two elements of quality and cost were developed. The quality loss
                        function (QLF) is one of the tools attempting to link quality and cost.