
Page 34 - Six Sigma for electronics design and manufacturing
P. 34
The Nature of Six Sigma and Its Connectivity to Other Quality Tools
million people in March 1999 to 304 million in March 2000, an in-
crease of 78%.
In quality, similar improvements have been made, as shown by some
of the numbers quoted above. These improvements have led to an in-
crease in customer expectations of quality. Companies have responded
to this increase by continuously measuring themselves and their com-
petition in several areas of capabilities and performance. This concept,
also known as benchmarking, is a favorite tool of managers to set goals
for the enterprise that are commensurate with their competition. They
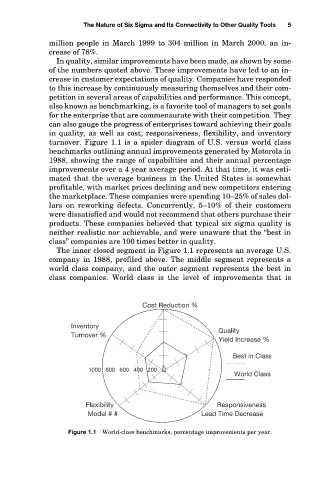
can also gauge the progress of enterprises toward achieving their goals 5
in quality, as well as cost, responsiveness, flexibility, and inventory
turnover. Figure 1.1 is a spider diagram of U.S. versus world class
benchmarks outlining annual improvements generated by Motorola in
1988, showing the range of capabilities and their annual percentage
improvements over a 4 year average period. At that time, it was esti-
mated that the average business in the United States is somewhat
profitable, with market prices declining and new competitors entering
the marketplace. These companies were spending 10–25% of sales dol-
lars on reworking defects. Concurrently, 5–10% of their customers
were dissatisfied and would not recommend that others purchase their
products. These companies believed that typical six sigma quality is
neither realistic nor achievable, and were unaware that the “best in
class” companies are 100 times better in quality.
The inner closed segment in Figure 1.1 represents an average U.S.
company in 1988, profiled above. The middle segment represents a
world class company, and the outer segment represents the best in
class companies. World class is the level of improvements that is
Cost Reduction %
Inventory
Quality
Turnover %
Yield Increase %
Best in Class
1000 800 600 400 200
World Class
Flexibility Responsiveness
Model # # Lead Time Decrease
Figure 1.1 World-class benchmarks, percentage improvements per year.