
Page 153 -
P. 153
136 Chapter 5 System modeling
Full Full Power
Power
Do: Set Power
= 600
Timer
Waiting
Number
Do: Display
Time Full Set Time Operation
Power Do: Get Number Do: Operate
Exit: Set Time Oven
Half
Power
Half Door
Power Cancel
Timer Closed
Start
Door
Open
Door
Half Power Enabled Open Waiting
Do: Set Power Do: Display Do: Display
= 300 'Ready' Time
Door Closed
Disabled
Do: Display
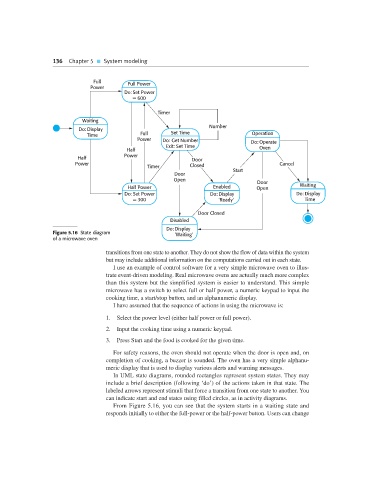
Figure 5.16 State diagram 'Waiting'
of a microwave oven
transitions from one state to another. They do not show the flow of data within the system
but may include additional information on the computations carried out in each state.
I use an example of control software for a very simple microwave oven to illus-
trate event-driven modeling. Real microwave ovens are actually much more complex
than this system but the simplified system is easier to understand. This simple
microwave has a switch to select full or half power, a numeric keypad to input the
cooking time, a start/stop button, and an alphanumeric display.
I have assumed that the sequence of actions in using the microwave is:
1. Select the power level (either half power or full power).
2. Input the cooking time using a numeric keypad.
3. Press Start and the food is cooked for the given time.
For safety reasons, the oven should not operate when the door is open and, on
completion of cooking, a buzzer is sounded. The oven has a very simple alphanu-
meric display that is used to display various alerts and warning messages.
In UML state diagrams, rounded rectangles represent system states. They may
include a brief description (following ‘do’) of the actions taken in that state. The
labeled arrows represent stimuli that force a transition from one state to another. You
can indicate start and end states using filled circles, as in activity diagrams.
From Figure 5.16, you can see that the system starts in a waiting state and
responds initially to either the full-power or the half-power button. Users can change