
Page 152 -
P. 152
5.4 Behavioral models 135
Purchase Officer Supplier
«datastore»
:Order Budget Orders
Fillin ( )
Validate ( )
[Validation OK]
Update (Amount)
Figure 5.14 An activity Save ( ) Send ( )
model of the insulin
pump’s operation
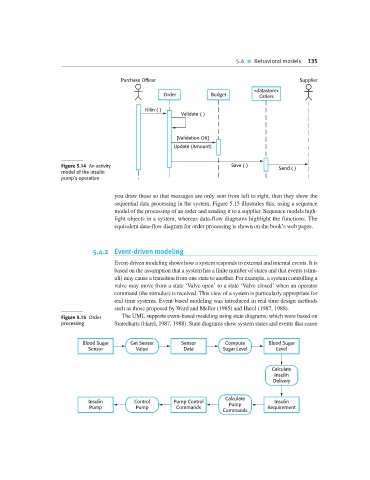
you draw these so that messages are only sent from left to right, then they show the
sequential data processing in the system. Figure 5.15 illustrates this, using a sequence
model of the processing of an order and sending it to a supplier. Sequence models high-
light objects in a system, whereas data-flow diagrams highlight the functions. The
equivalent data-flow diagram for order processing is shown on the book’s web pages.
5.4.2 Event-driven modeling
Event-driven modeling shows how a system responds to external and internal events. It is
based on the assumption that a system has a finite number of states and that events (stim-
uli) may cause a transition from one state to another. For example, a system controlling a
valve may move from a state ‘Valve open’ to a state ‘Valve closed’ when an operator
command (the stimulus) is received. This view of a system is particularly appropriate for
real-time systems. Event-based modeling was introduced in real-time design methods
such as those proposed by Ward and Mellor (1985) and Harel (1987, 1988).
Figure 5.15 Order The UML supports event-based modeling using state diagrams, which were based on
processing Statecharts (Harel, 1987, 1988). State diagrams show system states and events that cause
Blood Sugar Get Sensor Sensor Compute Blood Sugar
Sensor Value Data Sugar Level Level
Calculate
Insulin
Delivery
Calculate
Insulin Control Pump Control Pump Insulin
Pump Pump Commands Requirement
Commands