
Page 333 -
P. 333
316 Chapter 12 Dependability and security specification
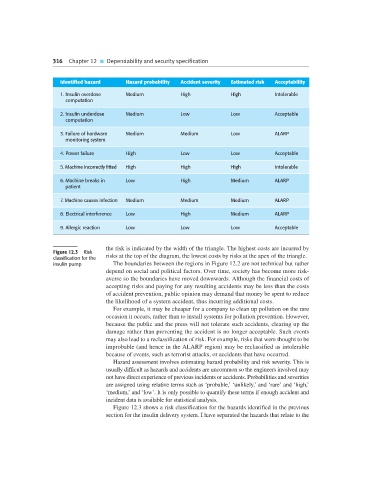
Identified hazard Hazard probability Accident severity Estimated risk Acceptability
1. Insulin overdose Medium High High Intolerable
computation
2. Insulin underdose Medium Low Low Acceptable
computation
3. Failure of hardware Medium Medium Low ALARP
monitoring system
4. Power failure High Low Low Acceptable
5. Machine incorrectly fitted High High High Intolerable
6. Machine breaks in Low High Medium ALARP
patient
7. Machine causes infection Medium Medium Medium ALARP
8. Electrical interference Low High Medium ALARP
9. Allergic reaction Low Low Low Acceptable
the risk is indicated by the width of the triangle. The highest costs are incurred by
Figure 12.3 Risk
classification for the risks at the top of the diagram, the lowest costs by risks at the apex of the triangle.
insulin pump The boundaries between the regions in Figure 12.2 are not technical but rather
depend on social and political factors. Over time, society has become more risk-
averse so the boundaries have moved downwards. Although the financial costs of
accepting risks and paying for any resulting accidents may be less than the costs
of accident prevention, public opinion may demand that money be spent to reduce
the likelihood of a system accident, thus incurring additional costs.
For example, it may be cheaper for a company to clean up pollution on the rare
occasion it occurs, rather than to install systems for pollution prevention. However,
because the public and the press will not tolerate such accidents, clearing up the
damage rather than preventing the accident is no longer acceptable. Such events
may also lead to a reclassification of risk. For example, risks that were thought to be
improbable (and hence in the ALARP region) may be reclassified as intolerable
because of events, such as terrorist attacks, or accidents that have occurred.
Hazard assessment involves estimating hazard probability and risk severity. This is
usually difficult as hazards and accidents are uncommon so the engineers involved may
not have direct experience of previous incidents or accidents. Probabilities and severities
are assigned using relative terms such as ‘probable,’ ‘unlikely,’ and ‘rare’ and ‘high,’
‘medium,’ and ‘low’. It is only possible to quantify these terms if enough accident and
incident data is available for statistical analysis.
Figure 12.3 shows a risk classification for the hazards identified in the previous
section for the insulin delivery system. I have separated the hazards that relate to the