
Page 22 - Soil and water contamination, 2nd edition
P. 22
General introduction 9
a
5 km Ringold formation
lower mudd unit at
water table
100 H area
River/Ponds
20
20
20
100 D area
45 45 45
20 20 20 Basalt above water table
20 20 20 Nitrate (mg l -1 )
100 F area
100 N area Monitoring well
100 K area 100
100
100
100 B/C area 20 20 45 20 45 20 45 20
20
20
Umtanum Ridge Gable Buttle Gable Mt. Pond Gable Mountain Columbia river
200 west area 45 45 45 100 100 100
B Pond
20
TEDF
20
20
ETF
ERDF
U pond BC Cribs
45
45
45
US Ecology
20
20
20
Yakima Ridge
6642 6642 6642
b
6642 6642 6642
Diffuse N Emissions 1990-1995
(kg ha -1 y -1 )
> 80 000
40 000
20 000
10 000
5 000
< 2 500
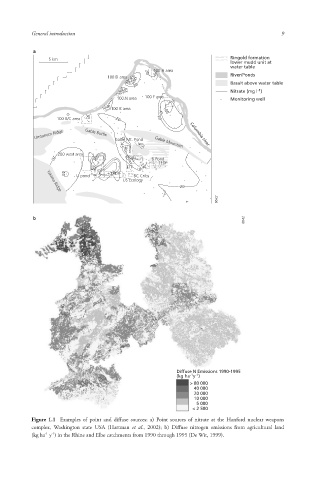
Figure 1.1 Examples of point and diffuse source s: a) Point sources of nitrate at the Hanford nuclear weapons
complex, Washington state USA (Hartman et al., 2002); b) Diffuse nitrogen emissions from agricultural land
-1
-1
(kg ha y ) in the Rhine and Elbe catchments from 1990 through 1995 (De Wit, 1999).
10/1/2013 6:44:03 PM
Soil and Water.indd 21
Soil and Water.indd 21 10/1/2013 6:44:03 PM