
Page 409 - Soil and water contamination, 2nd edition
P. 409
396 Soil and Water Contamination
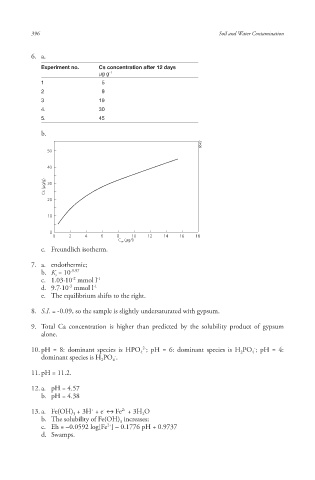
6. a.
Experiment no. Cs concentration after 12 days
µg g -1
1 5
2 9
3 19
4. 30
5. 45
b.
6642
50
40
Cs (μg/g) 30
20
10
0
0 2 4 6 8 10 12 14 16 18
C w (μg/l)
c. Freundlich isotherm.
7. a. endothermic;
b. K = 10 -9.97
s
-2
c. 1.03·10 mmol l -1
-3
d. 9.7·10 mmol l -1
e. The equilibrium shifts to the right.
8. S.I. = -0.09, so the sample is slightly undersaturated with gypsum.
9. Total Ca concentration is higher than predicted by the solubility product of gypsum
alone.
-
2-
10. pH = 8: dominant species is HPO ; pH = 6: dominant species is H PO ; pH = 4:
4
4
2
-
dominant species is H PO .
2 4
11. pH = 11.2.
12. a. pH = 4.57
b. pH = 4.38
2+
+
-
13. a. Fe(OH) + 3H + e ↔ Fe + 3H O
3 2
b. The solubility of Fe(OH) increases;
3
2+
c. Eh = –0.0592 log[Fe ] – 0.1776 pH + 0.9737
d. Swamps.
10/1/2013 6:47:53 PM
Soil and Water.indd 408 10/1/2013 6:47:53 PM
Soil and Water.indd 408