
Page 58 - Soil and water contamination, 2nd edition
P. 58
Basic environmental chemistry 45
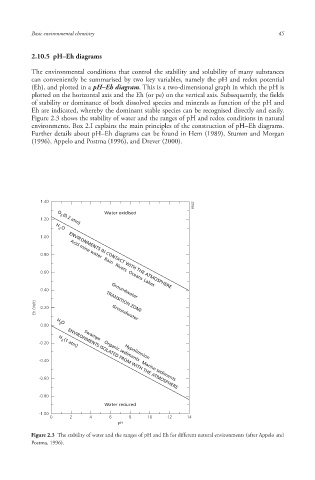
2.10.5 pH–Eh diagrams
The environmental conditions that control the stability and solubility of many substances
can conveniently be summarised by two key variables, namely the pH and redox potential
(Eh), and plotted in a pH–Eh diagram . This is a two-dimensional graph in which the pH is
plotted on the horizontal axis and the Eh (or pe) on the vertical axis. Subsequently, the fields
of stability or dominance of both dissolved species and minerals as function of the pH and
Eh are indicated, whereby the dominant stable species can be recognised directly and easily.
Figure 2.3 shows the stability of water and the ranges of pH and redox conditions in natural
environments. Box 2.I explains the main principles of the construction of pH–Eh diagrams.
Further details about pH–Eh diagrams can be found in Hem (1989), Stumm and Morgan
(1996), Appelo and Postma (1996), and Drever (2000).
1.40
6642
Water oxidised
2
1.20 O (0.2 atm)
2
H O
1.00
0.80 ENVIRONMENTS IN CONTACT WITH THE ATMOSPHERE
Acid mine water
Rain
0.60 Rivers Oceans Lakes
0.40 Groundwater
Eh (Volt) 0.20 TRANSITION ZONE
Groundwater
2
0.00 H O
2 Swamps
-0.20 Organic sediments
H (1 atm)
Hypolimnion
-0.40 ENVIRONMENTS ISOLATED FROM WITH THE ATMOSPHERE
-0.60 Marine sediments
-0.80
Water reduced
-1.00
0 2 4 6 8 10 12 14
pH
Figure 2.3 The stability of water and the ranges of pH and Eh for different natural environments (after Appelo and
Postma, 1996).
10/1/2013 6:44:20 PM
Soil and Water.indd 57
Soil and Water.indd 57 10/1/2013 6:44:20 PM