
Page 145 - Solar Power in Building Design The Engineer's Complete Design Resource
P. 145
SOLAR POWER DESIGN 115
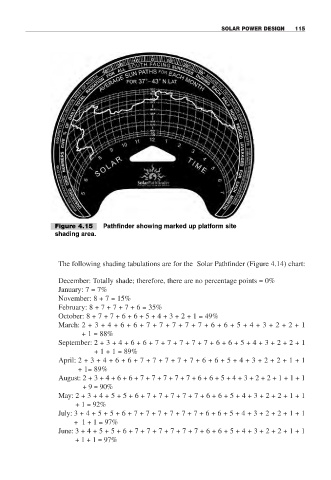
Figure 4.15 Pathfinder showing marked up platform site
shading area.
The following shading tabulations are for the Solar Pathfinder (Figure 4.14) chart:
December: Totally shade; therefore, there are no percentage points = 0%
January: 7 = 7%
November: 8 + 7 = 15%
February: 8 + 7 + 7 + 7 + 6 = 35%
October: 8 + 7 + 7 + 6 + 6 + 5 + 4 + 3 + 2 + 1 = 49%
March: 2 + 3 + 4 + 6 + 6 + 7 + 7 + 7 + 7 + 7 + 6 + 6 + 5 + 4 + 3 + 2 + 2 + 1
+ 1 = 88%
September: 2 + 3 + 4 + 6 + 6 + 7 + 7 + 7 + 7 + 7 + 6 + 6 + 5 + 4 + 3 + 2 + 2 + 1
+ 1 + 1 = 89%
April: 2 + 3 + 4 + 6 + 6 + 7 + 7 + 7 + 7 + 7 + 6 + 6 + 5 + 4 + 3 + 2 + 2 + 1 + 1
+ 1= 89%
August: 2 + 3 + 4 + 6 + 6 + 7 + 7 + 7 + 7 + 7 + 6 + 6 + 5 + 4 + 3 + 2 + 2 + 1 + 1 + 1
+ 9 = 90%
May: 2 + 3 + 4 + 5 + 5 + 6 + 7 + 7 + 7 + 7 + 7 + 6 + 6 + 5 + 4 + 3 + 2 + 2 + 1 + 1
+ 1 = 92%
July: 3 + 4 + 5 + 5 + 6 + 7 + 7 + 7 + 7 + 7 + 7 + 6 + 6 + 5 + 4 + 3 + 2 + 2 + 1 + 1
+ 1 + 1 = 97%
June: 3 + 4 + 5 + 5 + 6 + 7 + 7 + 7 + 7 + 7 + 7 + 6 + 6 + 5 + 4 + 3 + 2 + 2 + 1 + 1
+ 1 + 1 = 97%