
Page 279 - Solar Power in Building Design The Engineer's Complete Design Resource
P. 279
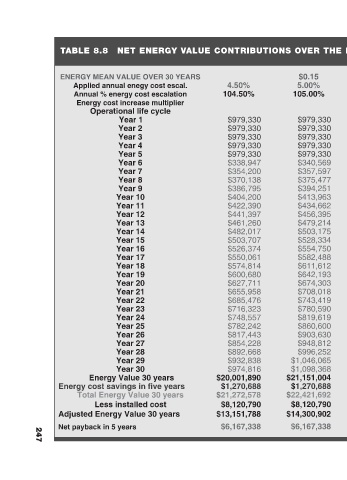
NET ENERGY VALUE CONTRIBUTIONS OVER THE PV SYSTEM’S LIFE SPAN OF 30 YEARS

                 $0.15  $0.46 5 YR INCENT.   ENERGY  8.00%  7.00%  6.00%  5.00%  UNIT COST 108.00% 107.00% 106.00% 105.00%  REBATE  $979,330 $979,330 $979,330 $979,330  $0.46  $979,330 $979,330 $979,330 $979,330  $979,330 $979,330 $979,330 $979,330  $979,330 $979,330 $979,330 $979,330  MEDIAN COST $979,330 $979,330 $979,330 $979,330  $350,299 $347,056 $343,812 $340,569


                  4.50%  104.50%  $979,330  $979,330  $979,330  $979,330  $979,330  $338,947  $354,200  $370,138  $386,795  $404,200  $422,390  $441,397  $461,260  $482,017  $503,707  $526,374  $550,061  $574,814  $600,680  $627,711  $655,958  $685,476  $716,323  $748,557  $782,242  $817,443  $854,228  $892,668  $932,838  $974,816  $20,001,890  $1,270,688  $21,272,578


                 ENERGY MEAN VALUE OVER 30 YEARS Applied annual enegy cost escal. Annual % energy cost escalation Energy cost increase multiplier Operational life cycle  Year 1  Year 2  Year 3  Year 4  Year 5  Year 6  Year 7  Year 8  Year 9  Year 10  Year 11  Year 12  Year 13  Year 14  Year 15  Year 16  Year 17  Year 18  Year 19  Year 20  Year 21  Year 22  Year 23  Year


           TABLE 8.8                                                                 Net payback in 5 years


                                                                                    247