Page 160 - Solid Waste Analysis and Minimization a Systems Approach
P. 160

138     THE GENERAL APPROACH FOR A SOLID WASTE ASSESSMENT


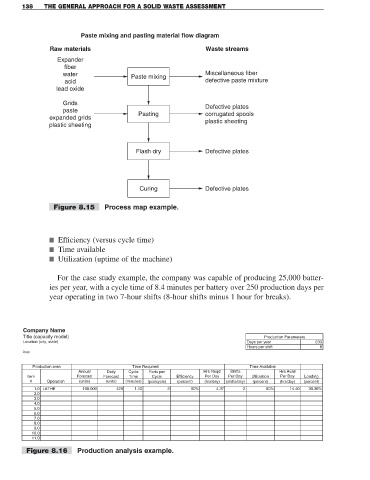
                            Paste mixing and pasting material flow diagram

                 Raw materials                                       Waste streams
                    Expander
                      fiber
                      water                 Paste mixing             Miscellaneous fiber
                      acid                                           defective paste mixture
                    lead oxide

                      Grids
                                                                     Defective plates
                      paste
                                               Pasting               corrugated spools
                 expanded grids
                                                                     plastic sheeting
                 plastic sheeting


                                              Flash dry              Defective plates


                                               Curing                Defective plates


                   Figure 8.15      Process map example.


                 ■ Efficiency (versus cycle time)
                 ■ Time available
                 ■ Utilization (uptime of the machine)


                    For the case study example, the company was capable of producing 25,000 batter-
                 ies per year, with a cycle time of 8.4 minutes per battery over 250 production days per
                 year operating in two 7-hour shifts (8-hour shifts minus 1 hour for breaks).


         Company Name
         Title (capacity model)                                                         Production Parameters
         Location (city, state)                                                    Days per year         233
                                                                                   Hours per shift         8
         Date:

            Production area                  Time Required                          Time Available
                           Annual   Daily   Cycle  Parts per        Hrs Reqd  Shifts         Hrs Avail
          Item            Forecast  Forecast  Time  Cycle  Efficiency  Per Day  Per Day  Utilization  Per Day  Loading
           #     Operation  (units)  (units)  (minutes)  (pcs/cycle)  (percent)  (hrs/day)  (shifts/day)  (percent)  (hrs/day)  (percent)
            1.0 LATHE       100,000     429   1.10      2       90%      4.37    2       90%     14.40  30.36%
            2.0
            3.0
            4.0
            5.0
            6.0
            7.0
            8.0
            9.0
            10.0
            11.0
          Figure 8.16      Production analysis example.
   155   156   157   158   159   160   161   162   163   164   165