
Page 159 - Solid Waste Analysis and Minimization a Systems Approach
P. 159
STEP 3: PROCESS MAPPING AND PRODUCTION ANALYSIS 137
SUMMARY
CATEGORY NO. DIST.
OPERATIONS
PROCESS DESCRIPTION: TRANSPORTS
COMPANY/LOCATION:
RECORDED BY: INSPECTIONS
DELAYS
DATE: STORAGES
TOTALS
OPERATION TRANSFER INSPECTION DELAY STORAGE DESCRIPTION OF METHOD DISTANCE CYCLE TIME
STEP
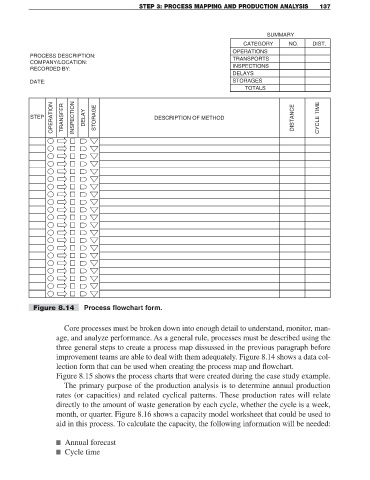
Figure 8.14 Process flowchart form.
Core processes must be broken down into enough detail to understand, monitor, man-
age, and analyze performance. As a general rule, processes must be described using the
three general steps to create a process map dissussed in the previous paragraph before
improvement teams are able to deal with them adequately. Figure 8.14 shows a data col-
lection form that can be used when creating the process map and flowchart.
Figure 8.15 shows the process charts that were created during the case study example.
The primary purpose of the production analysis is to determine annual production
rates (or capacities) and related cyclical patterns. These production rates will relate
directly to the amount of waste generation by each cycle, whether the cycle is a week,
month, or quarter. Figure 8.16 shows a capacity model worksheet that could be used to
aid in this process. To calculate the capacity, the following information will be needed:
■ Annual forecast
■ Cycle time