
Page 256 - Solid Waste Analysis and Minimization a Systems Approach
P. 256
234 DATA COLLECTION
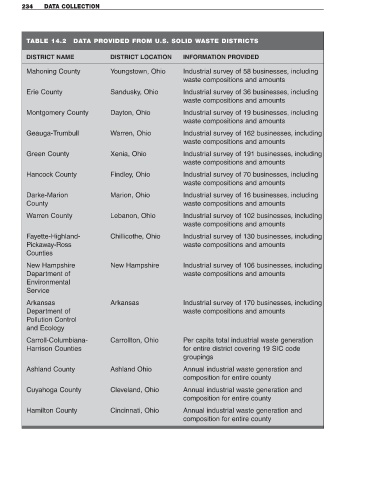
TABLE 14.2 DATA PROVIDED FROM U.S. SOLID WASTE DISTRICTS
DISTRICT NAME DISTRICT LOCATION INFORMATION PROVIDED
Mahoning County Youngstown, Ohio Industrial survey of 58 businesses, including
waste compositions and amounts
Erie County Sandusky, Ohio Industrial survey of 36 businesses, including
waste compositions and amounts
Montgomery County Dayton, Ohio Industrial survey of 19 businesses, including
waste compositions and amounts
Geauga-Trumbull Warren, Ohio Industrial survey of 162 businesses, including
waste compositions and amounts
Green County Xenia, Ohio Industrial survey of 191 businesses, including
waste compositions and amounts
Hancock County Findley, Ohio Industrial survey of 70 businesses, including
waste compositions and amounts
Darke-Marion Marion, Ohio Industrial survey of 16 businesses, including
County waste compositions and amounts
Warren County Lebanon, Ohio Industrial survey of 102 businesses, including
waste compositions and amounts
Fayette-Highland- Chillicothe, Ohio Industrial survey of 130 businesses, including
Pickaway-Ross waste compositions and amounts
Counties
New Hampshire New Hampshire Industrial survey of 106 businesses, including
Department of waste compositions and amounts
Environmental
Service
Arkansas Arkansas Industrial survey of 170 businesses, including
Department of waste compositions and amounts
Pollution Control
and Ecology
Carroll-Columbiana- Carrollton, Ohio Per capita total industrial waste generation
Harrison Counties for entire district covering 19 SIC code
groupings
Ashland County Ashland Ohio Annual industrial waste generation and
composition for entire county
Cuyahoga County Cleveland, Ohio Annual industrial waste generation and
composition for entire county
Hamilton County Cincinnati, Ohio Annual industrial waste generation and
composition for entire county