
Page 251 - Solid Waste Analysis and Minimization a Systems Approach
P. 251
DATA COLLECTION RESULTS AND DISCUSSION 229
SIC Number SIC Number
Group of Firms Group of Firms
Number Analyzed Number Analyzed
Description Description
01 Agricultural production crops 6 56 Apparel and accessory stores 7
02 Agricultural production livestock 5 57 Home furniture and furnishings 8
07 Agricultural services 2 58 Eating and drinking places 13
08 Forestry 3 59 Miscellaneous retail 8
10 Metal mining 3 60 Depository institutions 8
12 Coal mining 3 61 Non-depository credit institutions 6
15 Building construction and general contractors 8 62 Security and commodity brokers 6
16 Heavy construction 7 63 Insurance carriers 7
17 Construction special trade contractors 6 64 Insurance agents, brokers, and service 9
20 Food and kindred products 8 65 Real estate 8
22 Textile mill products 8 67 Holding and other investment offices 6
23 Apparel and other finished products 5 70 Hotels and other lodging places 7
24 Lumber and wood products 7 72 Personal services 8
25 Furniture and fixtures 7 73 Business services 12
26 Paper and allied products 6 75 Automotive repair, services, and parking 9
27 Printing, publishing, and allied industries 8 76 Miscellaneous repair services 8
28 Chemicals and allied products 5 78 Motion pictures 6
29 Petroleum refining and related industries 6 79 Amusement and recreation services 4
30 Rubber and miscellaneous plastics products 5 80 Health services 14
33 Primary metal industries 4 81 Legal services 7
34 Fabricated metal products 6 82 Educational services 8
35 Industrial and commercial machinery 9 83 Social services 6
36 Electronic and other electrical equipment 8 84 Museums and zoological gardens 4
37 Transportation equipment 14 86 Membership organizations 6
38 Controlling instruments 8 87 Engineering and management services 5
39 Miscellaneous manufacturing industries 7 91 Executive and legislative government 5
42 Motor freight transportation and warehousing 5 92 Justice, public order, and safety 6
50 Wholesale trade-durable goods 8 93 Public finance, taxation, and monetary policy 4
51 Wholesale trade-non-durable goods 7 94 Administration of human resource programs 5
52 Building materials and hardware 8 95 Administration of environmental quality 4
53 General merchandise stores 7 96 Administration of economic programs 3
54 Food stores 9 97 National security and international affairs 3
55 Automotive dealers and service stations 10
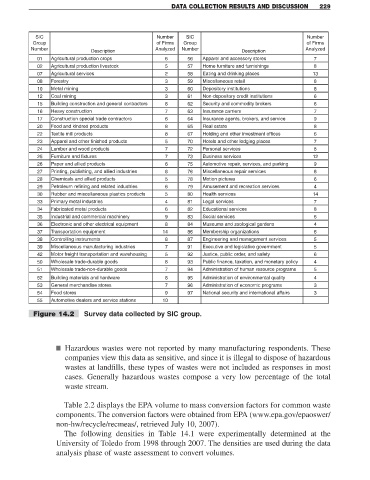
Figure 14.2 Survey data collected by SIC group.
■ Hazardous wastes were not reported by many manufacturing respondents. These
companies view this data as sensitive, and since it is illegal to dispose of hazardous
wastes at landfills, these types of wastes were not included as responses in most
cases. Generally hazardous wastes compose a very low percentage of the total
waste stream.
Table 2.2 displays the EPA volume to mass conversion factors for common waste
components. The conversion factors were obtained from EPA (www.epa.gov/epaoswer/
non-hw/recycle/recmeas/, retrieved July 10, 2007).
The following densities in Table 14.1 were experimentally determined at the
University of Toledo from 1998 through 2007. The densities are used during the data
analysis phase of waste assessment to convert volumes.