
Page 368 - Solid Waste Analysis and Minimization a Systems Approach
P. 368
346 CONSTRUCTION APPLICATIONS
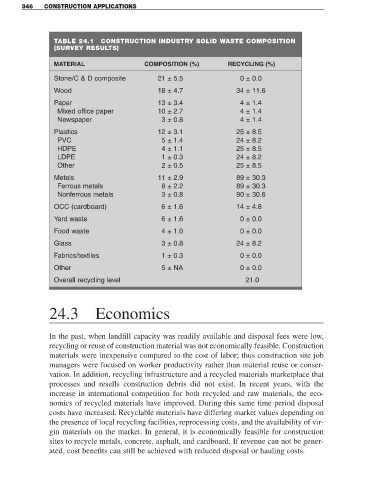
TABLE 24.1 CONSTRUCTION INDUSTRY SOLID WASTE COMPOSITION
(SURVEY RESULTS)
MATERIAL COMPOSITION (%) RECYCLING (%)
Stone/C & D composite 21 ± 5.5 0 ± 0.0
Wood 18 ± 4.7 34 ± 11.6
Paper 13 ± 3.4 4 ± 1.4
Mixed office paper 10 ± 2.7 4 ± 1.4
Newspaper 3 ± 0.8 4 ± 1.4
Plastics 12 ± 3.1 25 ± 8.5
PVC 5 ± 1.4 24 ± 8.2
HDPE 4 ± 1.1 25 ± 8.5
LDPE 1 ± 0.3 24 ± 8.2
Other 2 ± 0.5 25 ± 8.5
Metals 11 ± 2.9 89 ± 30.3
Ferrous metals 8 ± 2.2 89 ± 30.3
Nonferrous metals 3 ± 0.8 90 ± 30.6
OCC (cardboard) 6 ± 1.6 14 ± 4.8
Yard waste 6 ± 1.6 0 ± 0.0
Food waste 4 ± 1.0 0 ± 0.0
Glass 3 ± 0.8 24 ± 8.2
Fabrics/textiles 1 ± 0.3 0 ± 0.0
Other 5 ± NA 0 ± 0.0
Overall recycling level 21.0
24.3 Economics
In the past, when landfill capacity was readily available and disposal fees were low,
recycling or reuse of construction material was not economically feasible. Construction
materials were inexpensive compared to the cost of labor; thus construction site job
managers were focused on worker productivity rather than material reuse or conser-
vation. In addition, recycling infrastructure and a recycled materials marketplace that
processes and resells construction debris did not exist. In recent years, with the
increase in international competition for both recycled and raw materials, the eco-
nomics of recycled materials have improved. During this same time period disposal
costs have increased. Recyclable materials have differing market values depending on
the presence of local recycling facilities, reprocessing costs, and the availability of vir-
gin materials on the market. In general, it is economically feasible for construction
sites to recycle metals, concrete, asphalt, and cardboard. If revenue can not be gener-
ated, cost benefits can still be achieved with reduced disposal or hauling costs.