Page 393 - Solid Waste Analysis and Minimization a Systems Approach
P. 393

WASTE MANAGEMENT GOALS AND OPPORTUNITIES              371


                    an assignment. They may still use heavy machinery and power tools in their everyday
                    work. As CNC machines have become less expensive, many smaller firms have started
                    using them.


                    27.2 Waste Management Goals

                    and Opportunities


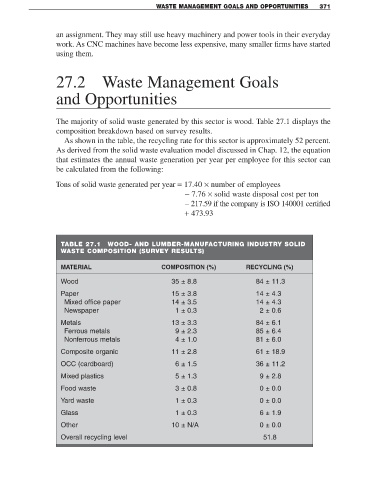
                    The majority of solid waste generated by this sector is wood. Table 27.1 displays the
                    composition breakdown based on survey results.
                      As shown in the table, the recycling rate for this sector is approximately 52 percent.
                    As derived from the solid waste evaluation model discussed in Chap. 12, the equation
                    that estimates the annual waste generation per year per employee for this sector can
                    be calculated from the following:

                   Tons of solid waste generated per year = 17.40 × number of employees
                                                              − 7.76 × solid waste disposal cost per ton
                                                              − 217.59 if the company is ISO 140001 certified
                                                              + 473.93


                     TABLE 27.1      WOOD- AND LUMBER-MANUFACTURING INDUSTRY SOLID
                     WASTE COMPOSITION (SURVEY RESULTS)


                     MATERIAL                         COMPOSITION (%)             RECYCLING (%)

                     Wood                                 35 ± 8.8                    84 ± 11.3
                     Paper                                15 ± 3.8                    14 ± 4.3
                      Mixed office paper                   14 ± 3.5                    14 ± 4.3
                      Newspaper                            1 ± 0.3                     2 ± 0.6
                     Metals                               13 ± 3.3                    84 ± 6.1
                      Ferrous metals                       9 ± 2.3                    85 ± 6.4
                      Nonferrous metals                    4 ± 1.0                    81 ± 6.0
                     Composite organic                    11 ± 2.8                    61 ± 18.9
                     OCC (cardboard)                       6 ± 1.5                    36 ± 11.2

                     Mixed plastics                        5 ± 1.3                     9 ± 2.8

                     Food waste                            3 ± 0.8                     0 ± 0.0
                     Yard waste                            1 ± 0.3                     0 ± 0.0

                     Glass                                 1 ± 0.3                     6 ± 1.9
                     Other                                10 ± N/A                     0 ± 0.0

                     Overall recycling level                                            51.8
   388   389   390   391   392   393   394   395   396   397   398