
Page 495 - Solid Waste Analysis and Minimization a Systems Approach
P. 495
Working Day Average Weight (lb)/per Employes 0.13 0.10 0.17 0.11 0.09 0.09 0.08 1.75 0.06 0.24 0.17 0.57 0.13 0.12 0.15 0.11 0.06 0.33 0.27 0.52 0.17
Number of Employees 47 65 80 40 140 80 45 5 30 62 95 35 34 51 67 40 86 19 116 12 1149
Percentage of Total 3% 4% 7% 2% 7% 4% 2% 5% 1% 8% 8% 11% 2% 3% 5% 2% 3% 3% 16% 3%
Annual Average Weight (lb) 1585 1690 3425 1125 3160 1875 925 2190 415 3705 4035 5015 1080 1505 2550 1055 1370 1565 7820 1570 47,660
Working Day Average Weight (lb) 6.34 6.76 13.70 4.50 12.64 7.50 3.70 8.76 1.66 14.82 16.14 20.06 4.32 6.02 10.20 4.22 5.48 6.26 31.28 6.28 191
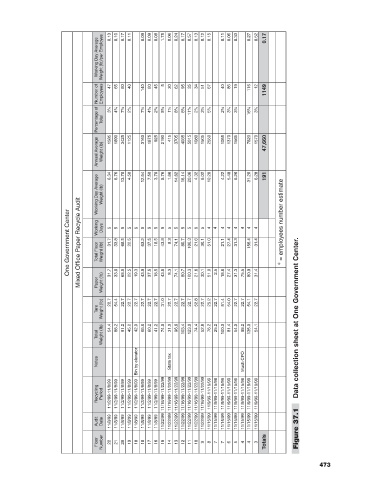
One Government Center Mixed Office Paper Recycle Audit Working Total Floor Days Weight (Ib) 5 31.7 31.7 5 33.8 33.8 5 68.5 68.5 5 22.5 22.5 5 19.3 5 63.2 43.9 5 37.5 37.5 5 18.5 18.5 5 43.8 43.8 5 8.3 8.3 5 74.1 74.1 5 80.7 80.7 5 100.3 100.3 5 21.6 21.6 5 30.1 30.1 4 51.0 51.0 4 2.5 4 21.1 18.6 4 27.4 27.4 4 31.3 31.3 4 75.5 4 156.4 80.9 4 31.4 31.4 ∗ = employees number estimate
Tare Paper Weight (Ib) Weight (Ib) 22.7 54.4 22.7 22.7 22.7 22.7 22.7 22.7 31.0 22.7 22.7 22.7 22.7 52.8 22.7 25.2 22.7 81.4 54.0 22.7 22.7 54.1 22.7 Data collection sheet at One Government Center.
Total Weight (Ib) 54.4 88.2 91.2 45.2 42.0 66.6 60.2 41.2 74.8 31.0 96.8 103.4 123.0 74.4 52.8 76.2 25.2 100.0 81.4 54.0 98.2 135.0 54.1
Bin by elevator
Notes State tax Much CPO
Recycling Period 11/2/99-11/8/99 11/2/99-11/8/99 11/2/99-11/8/99 11/2/99-11/8/99 11/2/99-11/8/99 11/2/99-11/8/99 11/2/99-11/8/99 11/2/99-11/8/99 11/16/99-11/22/99 11/16/99-11/22/99 11/16/99-11/22/99 11/16/99-11/22/99 11/16/99-11/22/99 11/16/99-11/22/99 11/16/99-11/22/99 11/9/99-11/15/99 11/9/99-11/15/99 11/9/99-11/15/99 11/9/99-11/15/99 11/9/99-11/15/99 11/9/99-11/15/99 11/9/99-11/15/99 11/9/99-11/15/99
Audit Date 11/8/99 11/8/99 11/8/99 11/8/99 11/8/99 11/8/99 11/8/99 11/8/99 11/22/99 11/22/99 11/22/99 11/22/99 11/22/99 11/22/99 11/22/99 11/15/99 11/15/99 11/15/99 11/15/99 11/15/99 11/15/99 11/15/99 11/15/99 Figure 37.1
Floor Number 22 21 20 19 18 18 17 16 15 14 13 12 11 10 9 8 7 7 6 5 4 4 3 Totals
473