
Page 496 - Solid Waste Analysis and Minimization a Systems Approach
P. 496
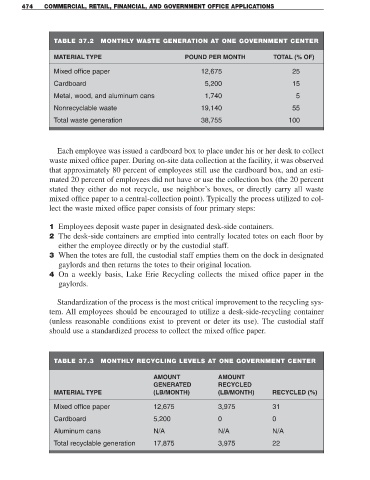
474     COMMERCIAL, RETAIL, FINANCIAL, AND GOVERNMENT OFFICE APPLICATIONS


                   TABLE 37.2     MONTHLY WASTE GENERATION AT ONE GOVERNMENT CENTER

                   MATERIAL TYPE                              POUND PER MONTH              TOTAL (% OF)

                   Mixed office paper                               12,675                         25

                   Cardboard                                         5,200                        15
                   Metal, wood, and aluminum cans                    1,740                         5

                   Nonrecyclable waste                             19,140                         55
                   Total waste generation                          38,755                       100


                    Each employee was issued a cardboard box to place under his or her desk to collect
                 waste mixed office paper. During on-site data collection at the facility, it was observed
                 that approximately 80 percent of employees still use the cardboard box, and an esti-
                 mated 20 percent of employees did not have or use the collection box (the 20 percent
                 stated they either do not recycle, use neighbor’s boxes, or directly carry all waste
                 mixed office paper to a central-collection point). Typically the process utilized to col-
                 lect the waste mixed office paper consists of four primary steps:


                 1 Employees deposit waste paper in designated desk-side containers.
                 2 The desk-side containers are emptied into centrally located totes on each floor by
                    either the employee directly or by the custodial staff.
                 3 When the totes are full, the custodial staff empties them on the dock in designated
                    gaylords and then returns the totes to their original location.
                 4 On a weekly basis, Lake Erie Recycling collects the mixed office paper in the
                    gaylords.


                    Standardization of the process is the most critical improvement to the recycling sys-
                 tem. All employees should be encouraged to utilize a desk-side-recycling container
                 (unless reasonable conditions exist to prevent or deter its use). The custodial staff
                 should use a standardized process to collect the mixed office paper.


                   TABLE 37.3     MONTHLY RECYCLING LEVELS AT ONE GOVERNMENT CENTER

                                                    AMOUNT               AMOUNT
                                                    GENERATED            RECYCLED
                   MATERIAL TYPE                    (LB/MONTH)           (LB/MONTH)        RECYCLED (%)

                   Mixed office paper                12,675               3,975             31

                   Cardboard                        5,200                0                 0
                   Aluminum cans                    N/A                  N/A               N/A

                   Total recyclable generation      17,875               3,975             22