
Page 524 - Solid Waste Analysis and Minimization a Systems Approach
P. 524
502 EDUCATION APPLICATIONS
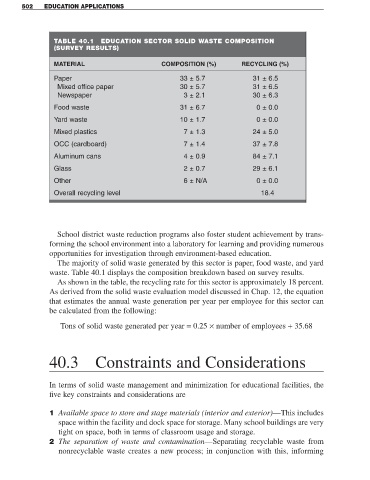
TABLE 40.1 EDUCATION SECTOR SOLID WASTE COMPOSITION
(SURVEY RESULTS)
MATERIAL COMPOSITION (%) RECYCLING (%)
Paper 33 ± 5.7 31 ± 6.5
Mixed office paper 30 ± 5.7 31 ± 6.5
Newspaper 3 ± 2.1 30 ± 6.3
Food waste 31 ± 6.7 0 ± 0.0
Yard waste 10 ± 1.7 0 ± 0.0
Mixed plastics 7 ± 1.3 24 ± 5.0
OCC (cardboard) 7 ± 1.4 37 ± 7.8
Aluminum cans 4 ± 0.9 84 ± 7.1
Glass 2 ± 0.7 29 ± 6.1
Other 6 ± N/A 0 ± 0.0
Overall recycling level 18.4
School district waste reduction programs also foster student achievement by trans-
forming the school environment into a laboratory for learning and providing numerous
opportunities for investigation through environment-based education.
The majority of solid waste generated by this sector is paper, food waste, and yard
waste. Table 40.1 displays the composition breakdown based on survey results.
As shown in the table, the recycling rate for this sector is approximately 18 percent.
As derived from the solid waste evaluation model discussed in Chap. 12, the equation
that estimates the annual waste generation per year per employee for this sector can
be calculated from the following:
Tons of solid waste generated per year = 0.25 × number of employees + 35.68
40.3 Constraints and Considerations
In terms of solid waste management and minimization for educational facilities, the
five key constraints and considerations are
1 Available space to store and stage materials (interior and exterior)—This includes
space within the facility and dock space for storage. Many school buildings are very
tight on space, both in terms of classroom usage and storage.
2 The separation of waste and contamination—Separating recyclable waste from
nonrecyclable waste creates a new process; in conjunction with this, informing