
Page 255 - Standard Handbook Of Petroleum & Natural Gas Engineering
P. 255
226 General Engineering and Science
Qin
&
T yq
condenser
0 0
I
S
(0) (b)
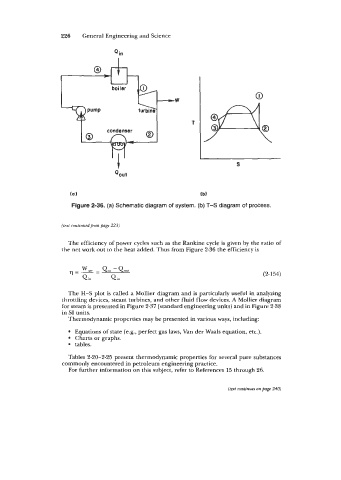
Figure 2-36. (a) Schematic diagram of system. (b) T-S diagram of process.
(text continued from page 223)
The efficiency of power cycles such as the Rankine cycle is given by the ratio of
the net work out to the heat added. Thus from Figure 2-36 the efficiency is
(2-154)
The H-S plot is called a Mollier diagram and is particularly useful in analyzing
throttling devices, steam turbines, and other fluid flow devices. A Mollier diagram
for steam is presented in Figure 2-37 (standard engineering units) and in Figure 2-38
in SI units.
Thermodynamic properties may be presented in various ways, including:
Equations of state (e.g., perfect gas laws, Van der Waals equation, etc.).
Charts or graphs.
tables.
Tables 2-20-2-25 present thermodynamic properties for several pure substances
commonly encountered in petroleum engineering practice.
For further information on this subject, refer to References 15 through 26.
(text continues on page 240)